


Every trade, back on the chart where it happened.
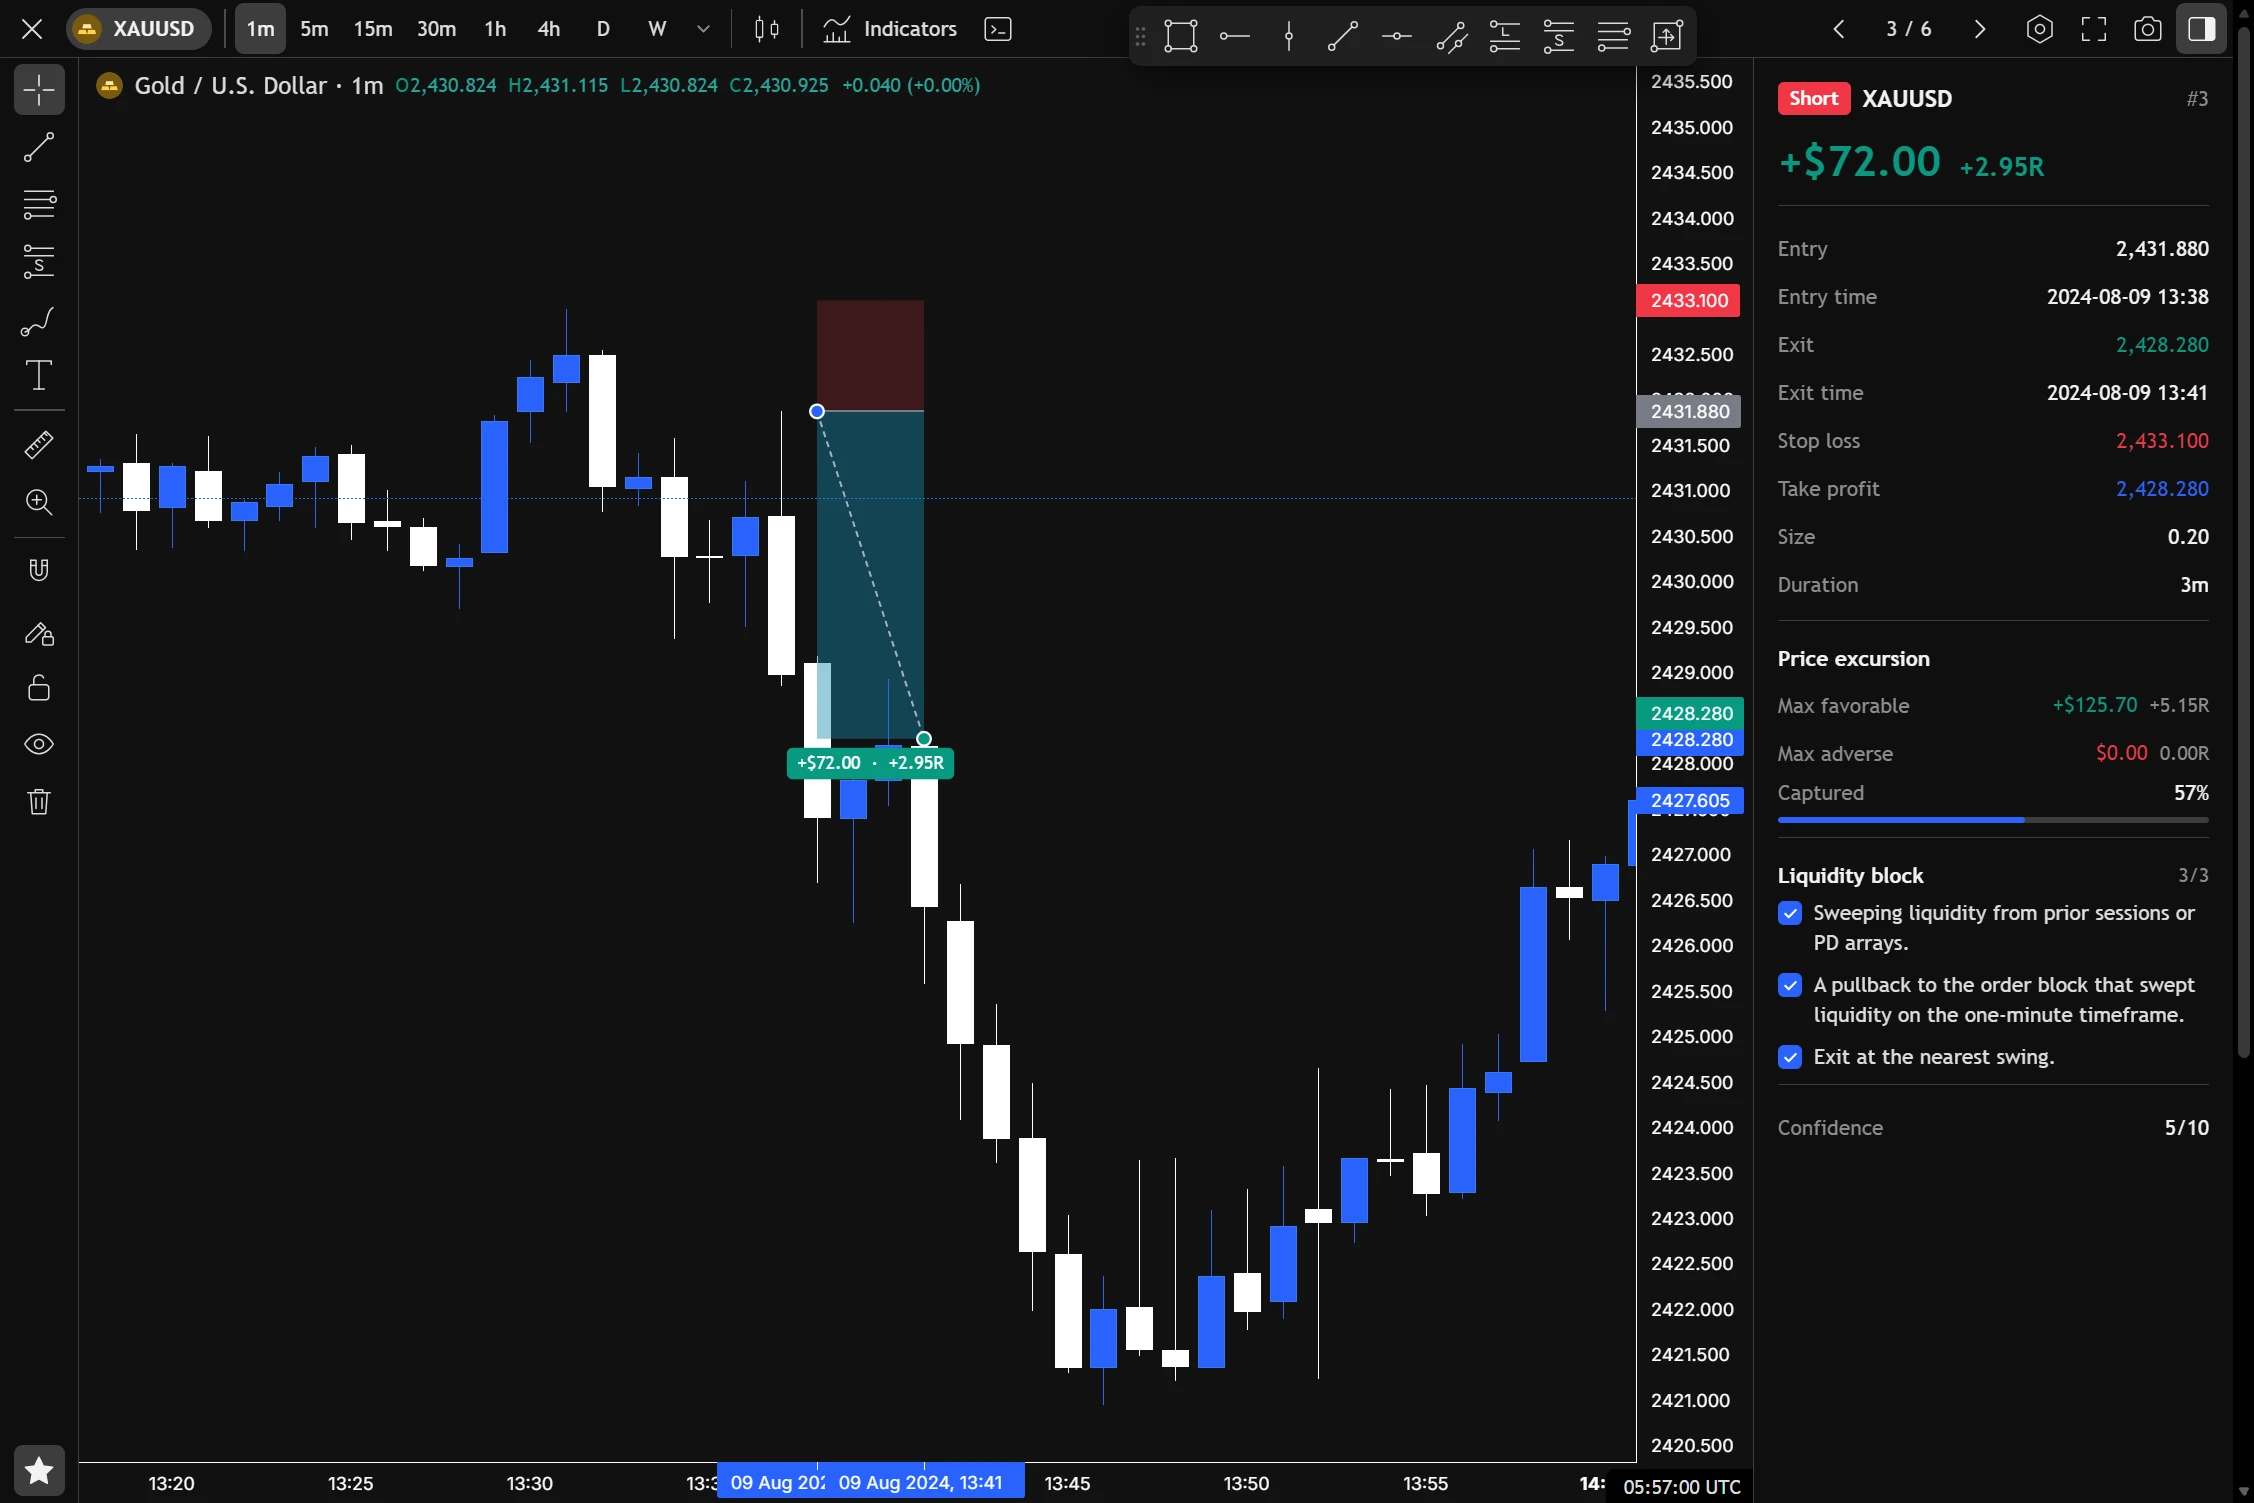
Open a trade and it comes back with your entry, stop, target and exit drawn in place. Replay it from the fill, candle by candle, with the P&L running — and see exactly how far it went for you and against you.
See it again, without knowing how it ends.
Hindsight makes every entry look obvious. Replay stops the chart at your fill and hands you the controls, so you judge the trade with only what you could see then.
- Play from entry, step one bar at a time, or run at 2×, 4× or 10×.
- The running P&L ticks with every candle, in money and in R.
- Switch timeframe mid-replay, from one minute to the week.
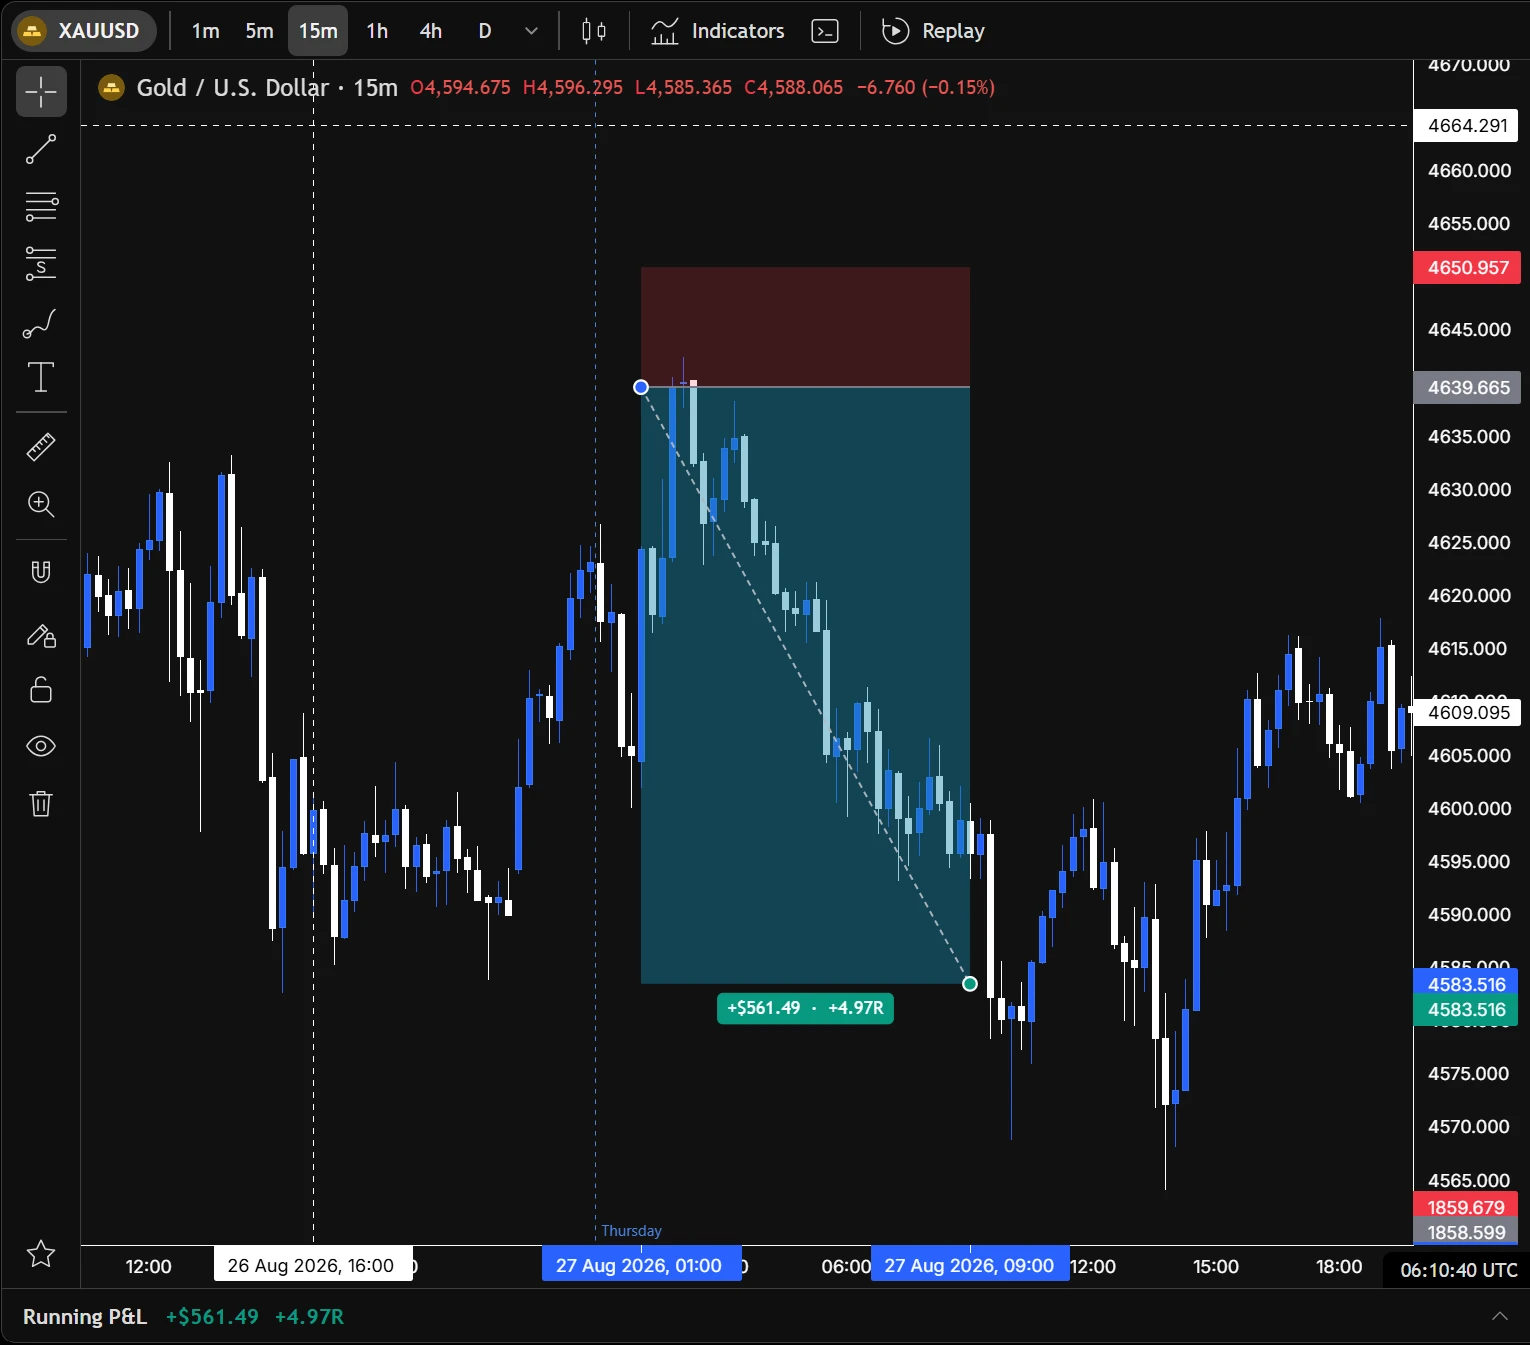
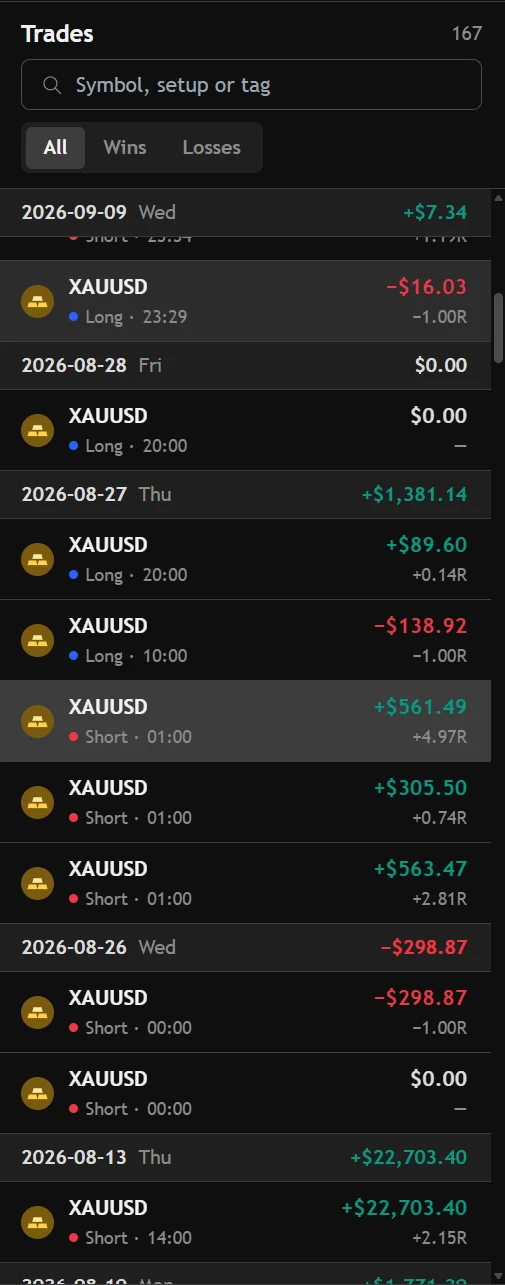
How far it went for you, and how far against.
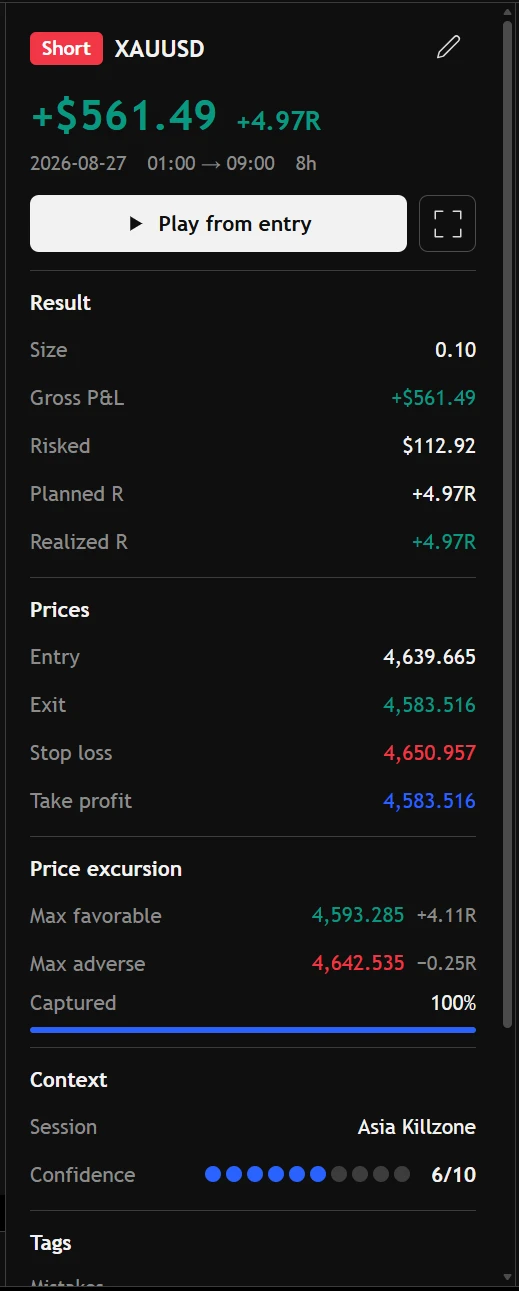
Maximum favourable and adverse excursion, in price and in R, for every trade with a stop. It is the plain answer to “were my stops too tight?” and “do I take profit too early?”.
- MAE and MFE on the trade, and across all your trades in Reports.
- How much of the available move you captured.
- Planned R against realised R, side by side.
A chart you already know how to use.
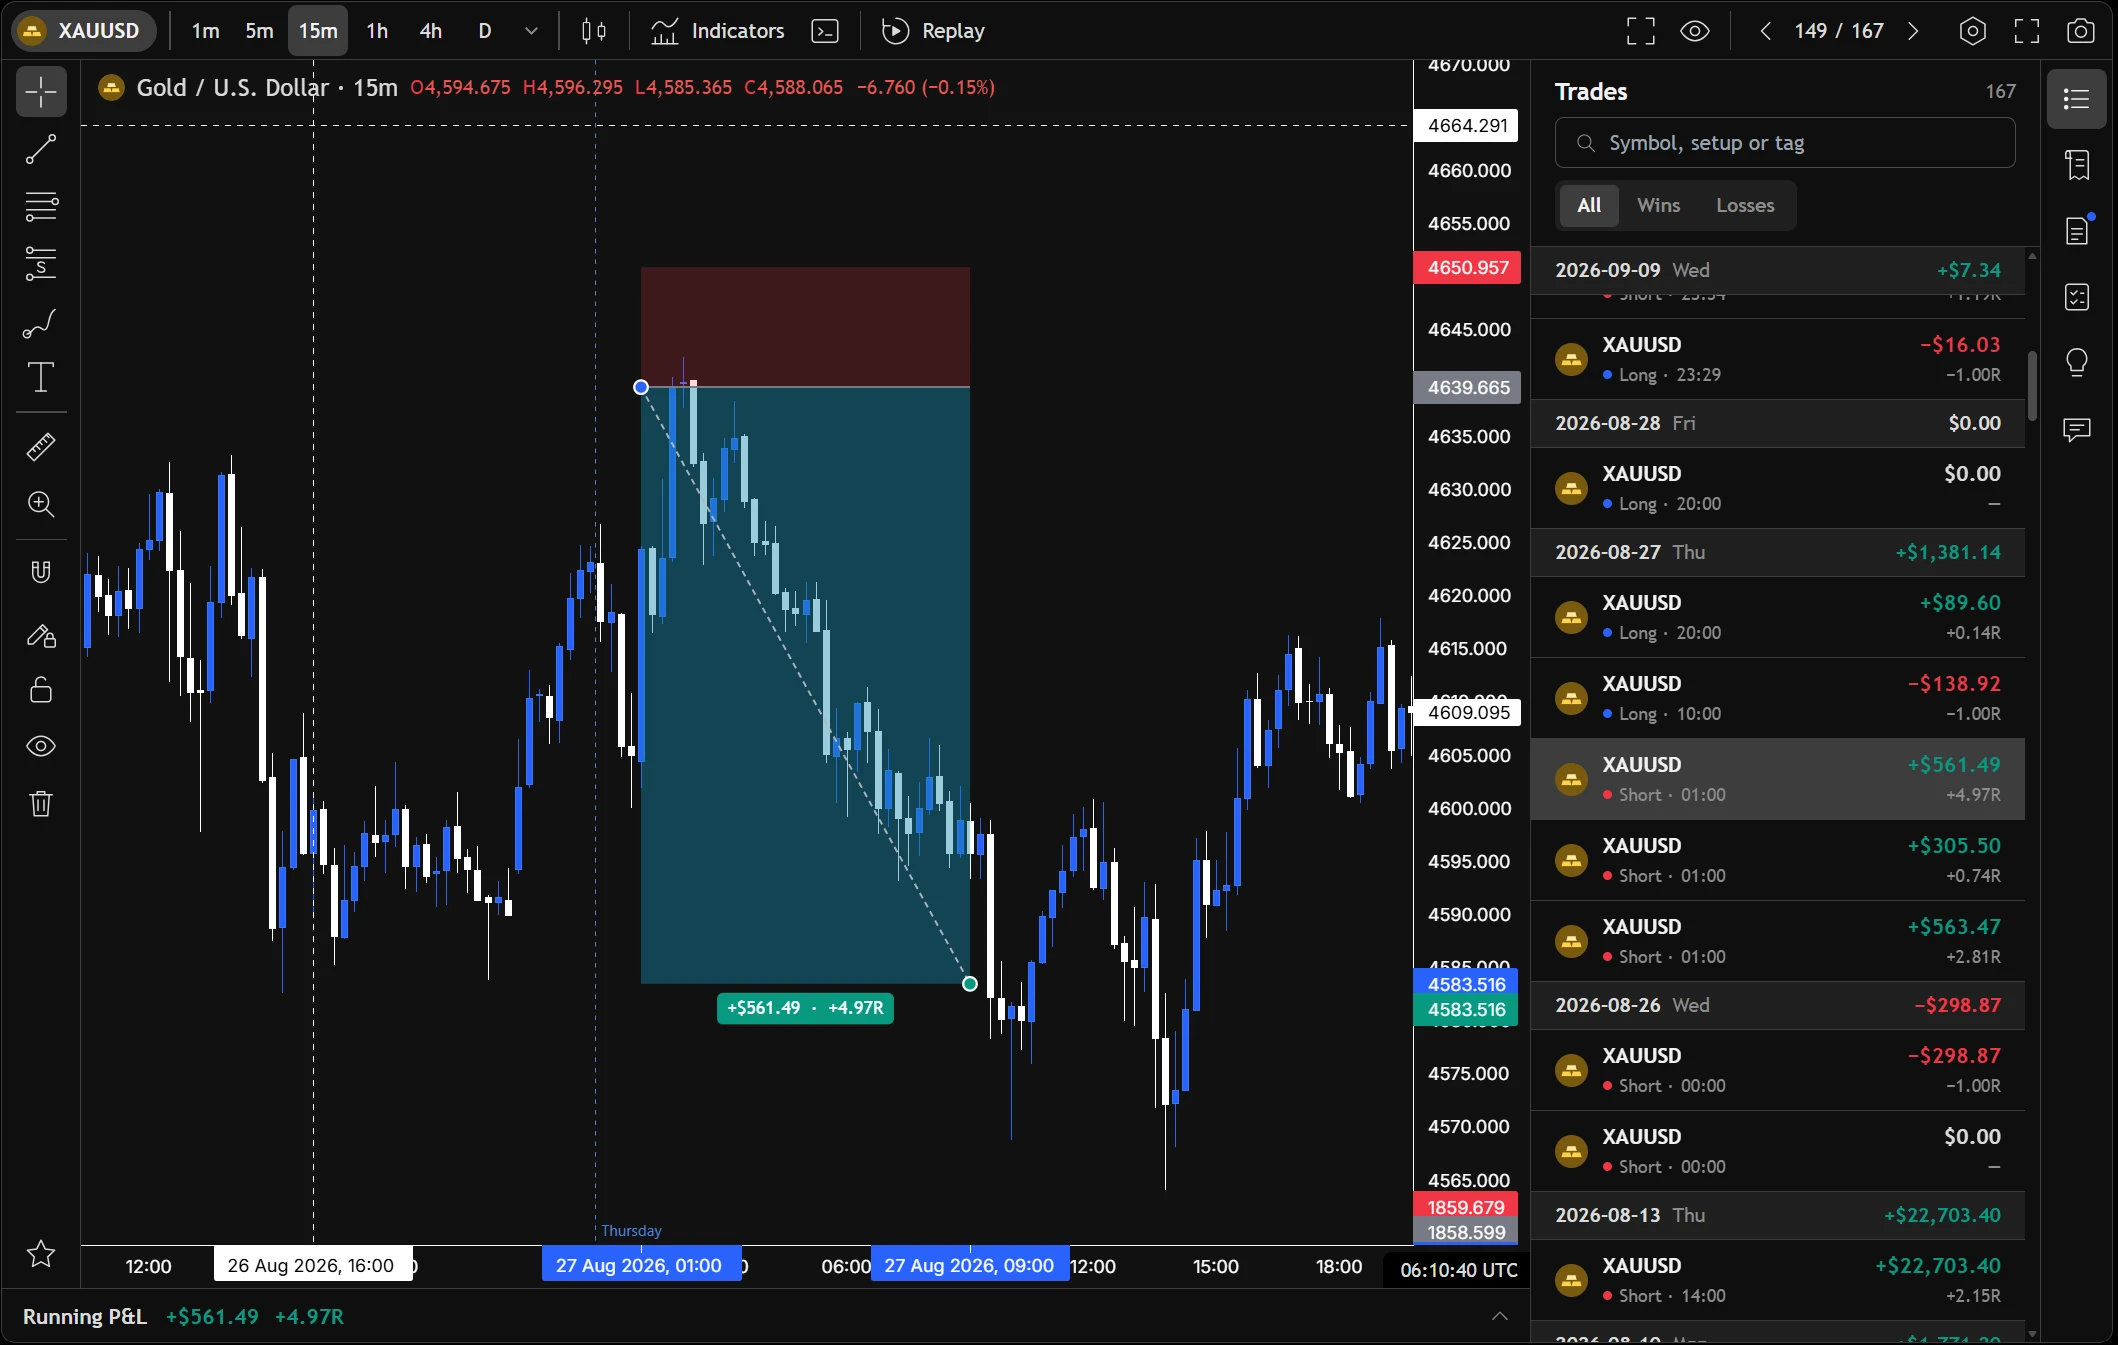
If you trade on TradingView, your hands already know this one: the same drawing tools, the same price scale, the same shortcuts.
- Trend lines, rays, fibs, boxes, text and the long and short position tools — kept with the trade.
- Indicators, including Pine scripts you paste in.
- Asia, London and New York sessions shaded on the chart, with daylight saving handled for each.
Built for reviewing trades, not for watching tickers.
About Trade Charts.
Where do the prices come from?
From real historical market data, on every timeframe from one minute to one week. How far back it reaches depends on the market.
Does it work for trades I imported?
Yes. Any trade with a symbol and its times opens on the chart, however it got into the journal.
Is it on the free plan?
Trade Charts and replay are part of Pro. The free plan keeps the journal, the calendar and the core reports.
Where the trades go next.
Your next trade deserves a reason.
Bring in your history and see what it says — free, in a few minutes.
Create your free accountAnswers to what traders ask us most — and a ticket to a person when they aren't enough.
Open helpsupport@tradeassay.com — read by the people who build the app.
Send an emailLong reads on sample size, R and prop-firm rules, each with a calculator.
Start reading