


If you have blown one evaluation you already know the strange part: the account usually dies during a week that did not feel unusual. No crash, no black swan. Two red days, one attempt to make it back, and the dashboard says the account is closed.
That is not bad luck, and it is usually not a bad strategy. It is arithmetic. A prop firm challenge is not a test of whether you can make money — it is a test of whether you can make money inside a specific set of loss constraints, and most traders never sit down and do the sums on what those constraints actually permit.
This guide walks through the six things that actually close funded accounts, with the numbers behind each one. There is a calculator halfway down that will tell you, in about ten seconds, whether your current risk per trade can survive your own strategy.
1A challenge is a risk test, not a profit test
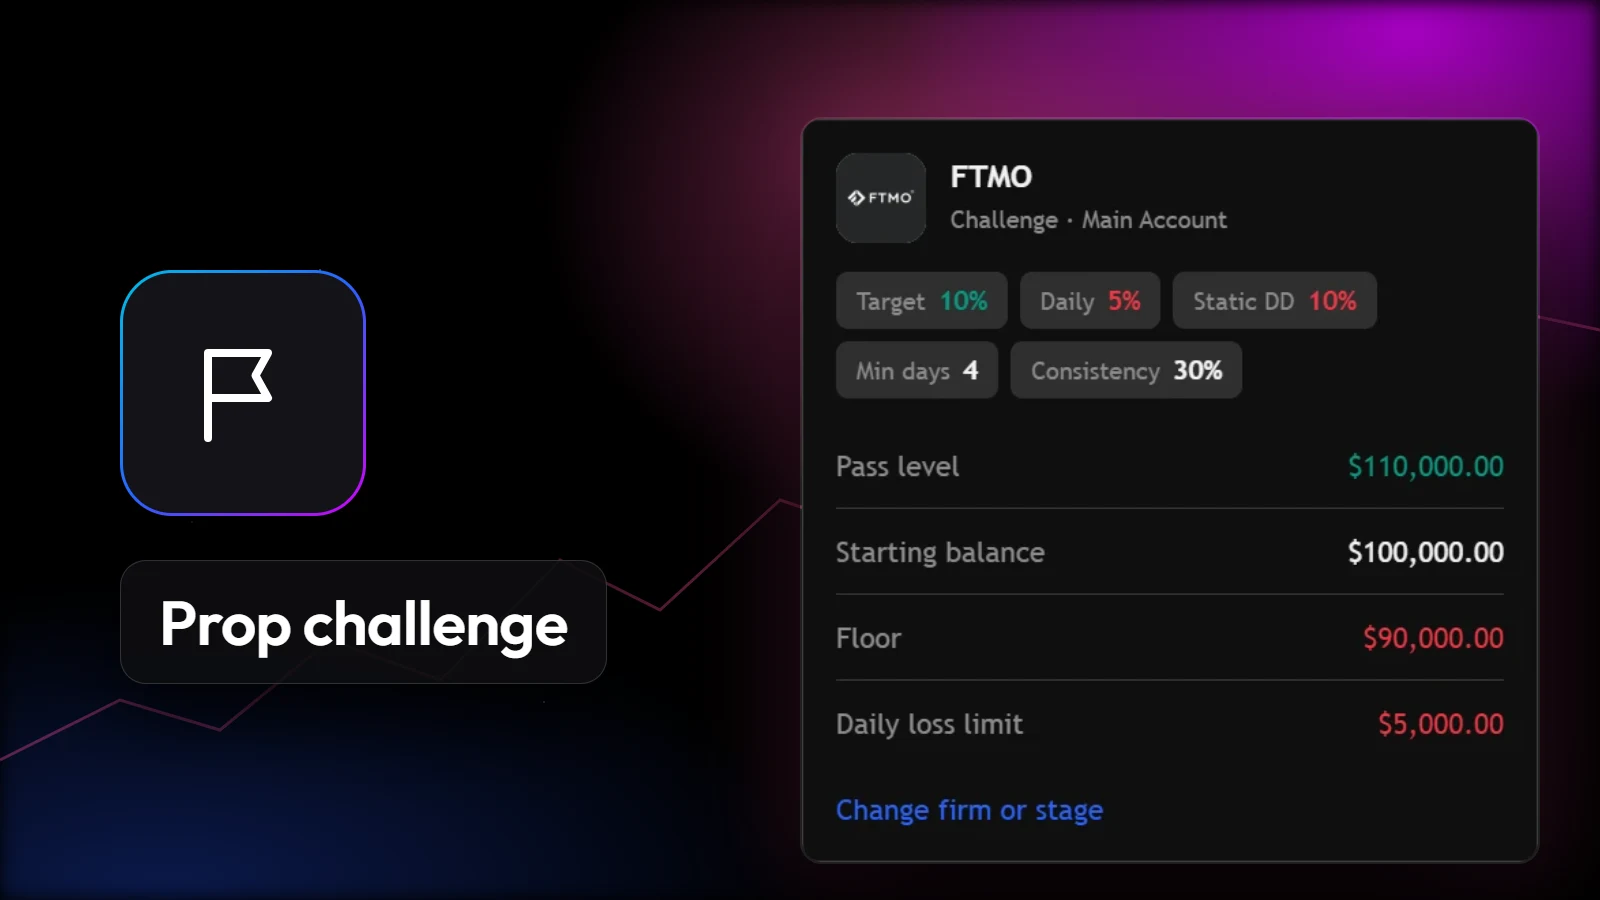
Read the rules of any evaluation and notice how they are weighted. There is normally one profit condition and three or four loss conditions: a maximum overall loss, a maximum daily loss, sometimes a minimum number of trading days, and increasingly a consistency rule capping how much of your profit may come from a single session.
The firm is not really asking "can you make 10%?" Plenty of people can make 10% in a month by taking enormous risk. The firm is asking a much narrower question: can you make 10% without ever losing 5% in a day or 10% in total? Those are different skills, and the second one is mostly position sizing.
A prop firm is not buying your returns. It is buying evidence that your losses are bounded — because that is the only thing that makes a funded account worth financing.
This reframing changes what you optimise. Treat the challenge as a profit target and you size up to reach it quickly. Treat it as a survival test and you size down, so a normal bad run cannot end you, and let a modest edge compound into the target over more trades.
2You are sized for the target, not the drawdown
This is the single most common reason traders fail prop firm challenges, and it is pure arithmetic. Take a typical structure — a 10% profit target with a 10% maximum loss — and ask how many consecutive losing trades your position size allows before the account is gone.
| Risk per trade | Losses to breach | Chance of that streak* | Verdict |
|---|---|---|---|
| 3% | 4 | about 1 in 11 | Very likely to fail |
| 2% | 5 | about 1 in 20 | Likely to fail |
| 1% | 10 | about 1 in 400 | Survivable |
| 0.5% | 20 | vanishingly small | Very safe |
*Probability of that exact run of consecutive losses for a strategy losing 55% of its trades — a perfectly normal 45% win rate. Across a full challenge you take many such sequences, so the real chance of meeting one is considerably higher than the figure shown.
Look at the 2% row carefully, because it is where most traders sit and it feels conservative. Five losses in a row at a 45% win rate is not a disaster scenario — it is a Tuesday. At 2% risk, that ordinary event ends a funded account.
The number nobody calculates: your expected worst streak
Here is the part that reframes everything. You can estimate the longest losing run you should expect across a given number of trades. For a loss rate p over n trades it is approximately ln(n) ÷ ln(1/p).
Run it for a normal challenge: 30 trades at a 45% win rate gives ln(30) ÷ ln(1/0.55) ≈ 5.7. So you should plan on hitting a run of roughly six consecutive losses at some point during the evaluation. Not fear it — expect it.
That comparison is the whole game. If the streak you should expect is longer than the streak your position size can absorb, the account fails and it is not variance, it is design. At 2% you can take five; you should expect nearly six. At 1% you can take ten, and the edge gets room to work.
The rule that follows: set risk per trade from the drawdown limit and your worst historical losing streak — never from how fast you want to reach the profit target. If your backtest shows a worst run of eight losses, then 1% risk against a 10% limit leaves almost no margin, and you belong at 0.75% or lower.
3Calculator: can your risk survive your edge?
Put your own numbers in. This compares the losing streak your strategy should produce against the one your position sizing can actually absorb — the comparison that decides most funded accounts before the first trade is placed.
Prop firm survival calculator
Nothing is sent anywhere — this runs entirely in your browser.
Assumes a fixed fractional risk model and independent trades. Real results cluster more than independence implies, so treat the expected streak as a floor rather than a ceiling.
4The daily loss limit punishes the recovery attempt
The maximum loss limit kills accounts slowly. The daily loss limit kills them in an afternoon, and it does so by punishing one specific behaviour: trying to win it back today.
On a 5% daily limit, risking 2% per trade gives you exactly two losing trades of headroom. The third breaches. So on any day where your first two trades lose — again, an ordinary occurrence — you are already finished, and every further trade is played with an account that cannot absorb a loss.
What happens at that moment is documented in almost every trader's own journal: the third trade is bigger than the first two, taken on a weaker setup, to recover the day. It is exactly the behaviour the daily loss limit exists to catch, and it catches it.
Discipline is doing arithmetic you should have done before the market opened.
The structural fix is to make the number visible before the order, not after. If you know you have 1.4% of daily headroom left, a 2% risk trade is obviously impossible and the decision makes itself. Find out afterwards and willpower is doing work that arithmetic should have done. This is why a trading journal that understands your firm's rules is more useful during an evaluation than after it.
5Trailing drawdown fails traders who are up on the month
This one catches good traders, and it catches them while they are profitable — which is why it produces so much confusion and so many angry forum posts.
Firms measure maximum loss in three common ways, and they behave very differently:
- Static drawdown — measured from your starting balance. The floor never moves. Simplest and most forgiving.
- Trailing drawdown (intraday) — measured from the highest equity the account has ever touched, including unrealised profit inside an open trade.
- Trailing drawdown (end of day) — measured from the highest closing balance, so intraday spikes do not count against you.
| Peak equity reached | Loss floor | Room left from peak |
|---|---|---|
| $100,000 (start) | $90,000 | 10.0% |
| $103,000 | $93,000 | 9.7% |
| $105,000 | $95,000 | 9.5% |
| $110,000 (target hit) | $100,000 | 9.1% |
Two practical consequences. First, under an intraday trailing rule, a trade that runs deep into profit and then reverses can raise your floor permanently even though you never banked the gain — so letting a winner give back most of its move costs far more than it appears. Second, on any trailing structure your effective risk budget shrinks as you approach the profit target, which is exactly when most traders increase position size to finish.
Before you buy an evaluation, find out which of the three applies. It changes the correct position size and it changes how you should manage open winners.
6You do not actually know your expectancy
Ask a trader who just failed what their expectancy is, in R, across their last two hundred trades. Most cannot answer — and that is the real problem, because everything above assumes you know your win rate and average reward-to-risk, and most people are estimating both from memory.
Memory is a poor instrument here, and it fails in a predictable direction. Wins are recalled more vividly than losses, break-even trades vanish entirely, and trades closed early to avoid a loss get remembered as risk management rather than as the R they actually cost.
There is also a sample size problem. Twenty trades tells you almost nothing: at a 45% win rate you could easily see nine winners or two, and either would feel like evidence. A challenge typically runs twenty to forty trades — which means the challenge is far too short to discover whether your strategy works. It can only reveal whether you can execute something you already established.
The evaluation is an exam, not a study session. Traders who fail are usually revising and sitting the paper at the same time.
That is the argument for doing discovery beforehand, on historical data, where a bad sample costs nothing. Running a strategy bar by bar through real historical price data — with everything after the current candle hidden, so hindsight cannot leak in — reaches a few hundred trades in an afternoon instead of a year. What you want from it is not a pretty equity curve but four numbers: expectancy in R, win rate, average R won versus lost, and worst losing streak. That last one sets your position size, as we saw above.
A test worth running today: take your last fifty trades and express each as an R multiple — profit or loss divided by the risk you had on at entry. Add them up. If the total is negative, no amount of discipline inside a challenge will save the funded account, and the work to do is on the strategy rather than on the evaluation.
Divide by the risk you had on at entry, not by wherever the stop ended up: if you moved it to breakeven the second number is smaller, and that alone can score a losing method as a winning one.
7You changed the strategy halfway through
This is the quietest failure mode, because it never feels like a decision. It feels like adapting.
The sequence is almost always identical. The first week goes badly. Setups that lost are mentally reclassified as "not my real setup". A slightly different entry trigger appears because the market is "different at the moment". Timeframes drift. By week three the trader is running something that was never tested, in an account that punishes variance, while believing they are following a plan.
It is hard to catch from the inside because every individual adjustment is defensible. Only the pattern is visible, and only in writing. A journal that tags each trade with its setup and playbook turns this from a feeling into a count: if 60% of this week's trades carry a setup that did not exist last month, the drift is no longer arguable.
Related is the consistency rule many firms now apply, capping the share of total profit that may come from a single day. A trader who makes the whole target in one lucky session can satisfy every loss rule and still be denied a payout. The defence is the same: a repeatable process producing many similar-sized results, not one heroic day.
8One-step or two-step: which is easier to pass?
Firms sell both, and the marketing usually frames the one-step challenge as the faster route to a funded account. Mathematically it is often the harder one.
The ratio that matters is profit target divided by drawdown allowance — how much you must make per unit of loss you are permitted. A one-step evaluation typically pairs a single 10% target with a tighter, frequently trailing, drawdown. A two-step spreads a smaller target (often 8% then 5%) across two phases with a more forgiving static limit.
| Structure | Target | Max loss | Target ÷ loss |
|---|---|---|---|
| One-step, trailing | 10% | 6% | 1.67 |
| Two-step, phase 1 | 8% | 10% | 0.80 |
| Two-step, phase 2 | 5% | 10% | 0.50 |
A ratio above 1.0 means you must earn more than you are allowed to lose, which forces larger position sizes and therefore shorter survivable streaks. That is why the one-step often has the lower pass rate despite sounding simpler. Two-step evaluations take longer, but each phase asks less profit per unit of drawdown — and time is the cheap resource here, while drawdown is the expensive one.
How to pass a prop firm challenge: the pre-challenge checklist
Run these before paying for the next evaluation. Each is answerable in an afternoon, and each maps to a failure mode above.
- Write the exact rules down in numbers. Maximum loss, daily loss, profit target, and critically which drawdown type — static, intraday trailing, or end-of-day trailing.
- Find your worst historical losing streak across at least a few hundred backtested or journalled trades.
- Set risk per trade from that streak, so the streak plus a margin still leaves the account alive. Not from the profit target.
- Confirm positive expectancy in R over a sample large enough to mean something. If it is negative, do not buy the challenge.
- Calculate trades needed — target in R divided by expectancy per trade. If that exceeds what the period allows, your risk is too small or your edge too thin. Find out now, not in week three.
- Set a personal daily stop below the firm's. If the rule is 5%, stop at 3%. That gap is what keeps a bad day from becoming a breach.
- Decide the recovery rule in advance — what you do after two losses in a day. The only answer that survives contact with a real drawdown is "stop trading today".
- Log every trade with its setup tag from day one, so strategy drift appears as a number in week two rather than as a post-mortem in week four.
What it all comes down to
Prop firms are not trying to trick you, and pass rates are not low because the rules are unfair. They are low because the rules test the one thing most retail traders have never measured: whether results are repeatable within a loss constraint.
Nearly everything on this page follows from one idea — know your expectancy and your worst losing streak before risking money on an evaluation, then size from those two numbers instead of from the target. Traders who do this find the challenge surprisingly boring, which is the point. The ones who fail are usually discovering a strategy and executing it at the same time, on a clock, with someone else's rules attached.
Do the discovery first, on data that costs nothing.
Frequently asked questions
Why do most traders fail prop firm challenges?
Most accounts are lost to risk limits rather than to a losing strategy. Traders size their positions against the profit target instead of the drawdown limit, so a normal losing streak breaches the maximum loss before the edge has time to show up. Daily loss limits and trailing drawdown then turn one bad session into a failed evaluation.
How much should I risk per trade in a prop firm challenge?
Size against the drawdown limit, not the target. On a typical 10% maximum loss, risking 1% per trade means ten consecutive losses before the funded account fails, while 2% means five. Five losses in a row happen roughly once in every twenty sequences at a 55% loss rate, so 2% risk turns an ordinary streak into a failure.
What is trailing drawdown and why does it fail profitable traders?
Trailing drawdown measures your maximum loss from the highest equity the account has ever reached, not from the starting balance. On a $100,000 account with a 10% trailing limit the floor starts at $90,000, but after a push to $105,000 the floor rises to $95,000. Give back that 5% and the account breaches while your balance is still at break-even.
How many trades do I need before I know my strategy works?
Far more than a challenge lasts. A twenty-trade sample tells you very little about expectancy, because a single outlier can flip the average. Establish expectancy in R across a large historical sample using backtesting and bar-by-bar replay before paying for an evaluation, so the challenge becomes execution rather than discovery.
Is a one-step or two-step prop firm challenge easier to pass?
One-step challenges usually pair a single profit target with a tighter drawdown, often trailing, while two-step challenges spread a smaller target across two phases with a more forgiving loss limit. For most traders the two-step is easier to pass, because each phase demands less profit per unit of drawdown — the ratio that actually decides survival.
Can I use a trading journal during a prop firm challenge?
Yes, and it is the single most useful habit during an evaluation. A trading journal that knows your firm's rules can show remaining daily loss headroom and distance to the drawdown floor before you place the next order, which is when the information is still actionable.