


What your numbers can and can't tell you.
Long reads on sample size, R, drawdown and prop-firm rules, from the desk that builds TradeAssay. Each one shows its arithmetic and ends in a calculator you can run on your own trades. No signals, no price calls.
 Prop firm trading
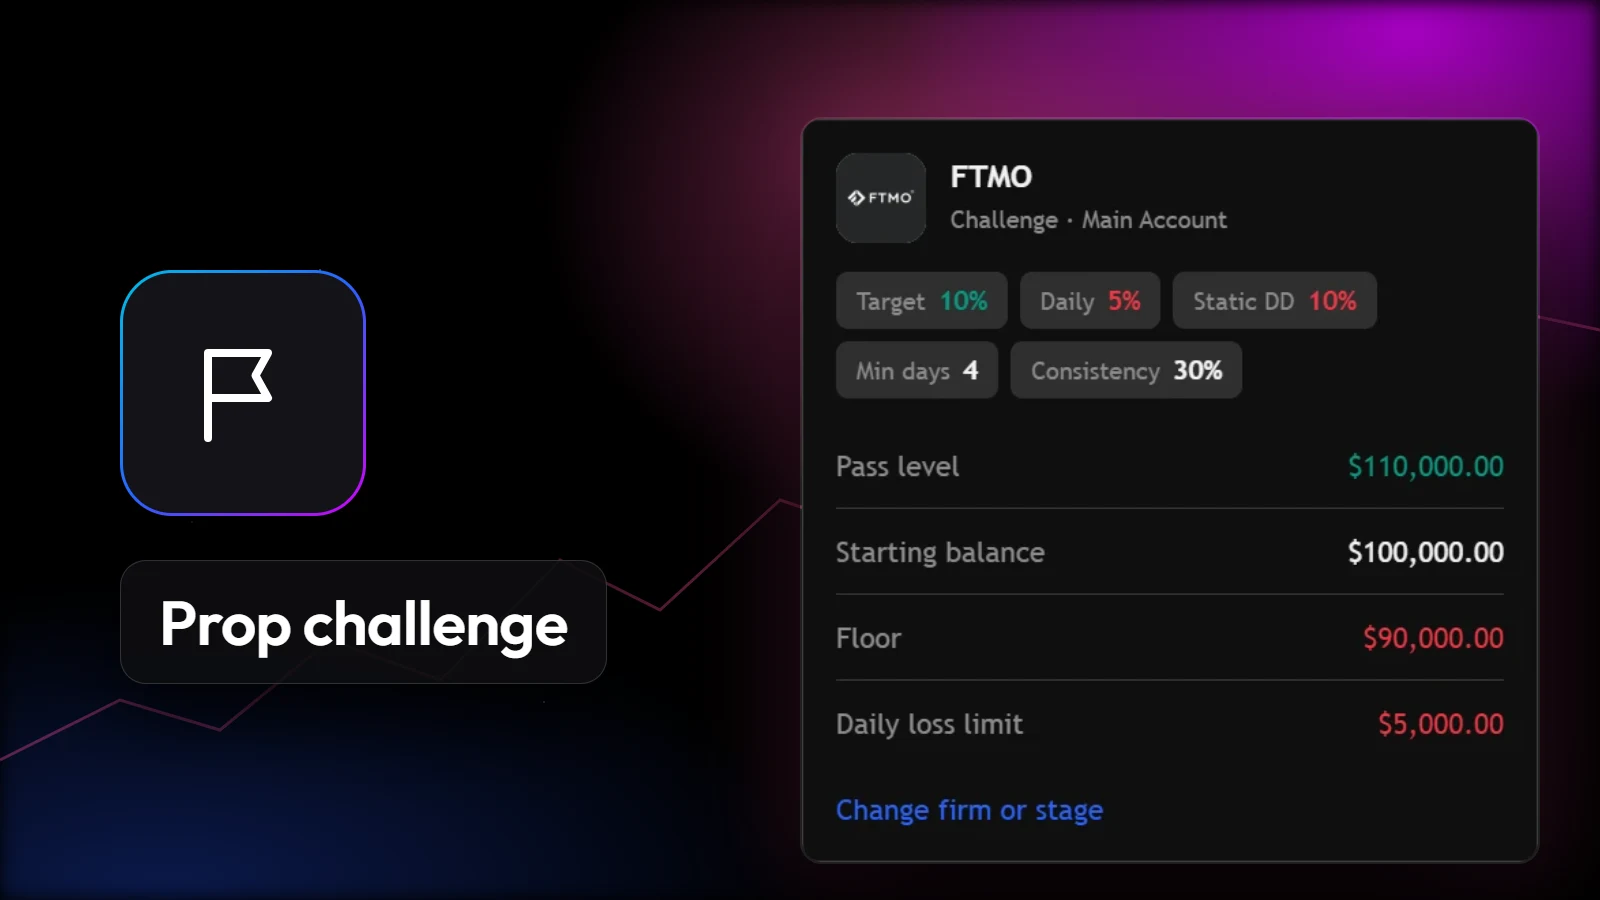
Why traders fail prop firm challenges — and how to pass one
Almost nobody fails an evaluation because the strategy stopped working. They fail because the size was set against the profit target instead of the loss limit, and an ordinary losing streak arrived before the edge had room to show up.
Read it, with the survival calculator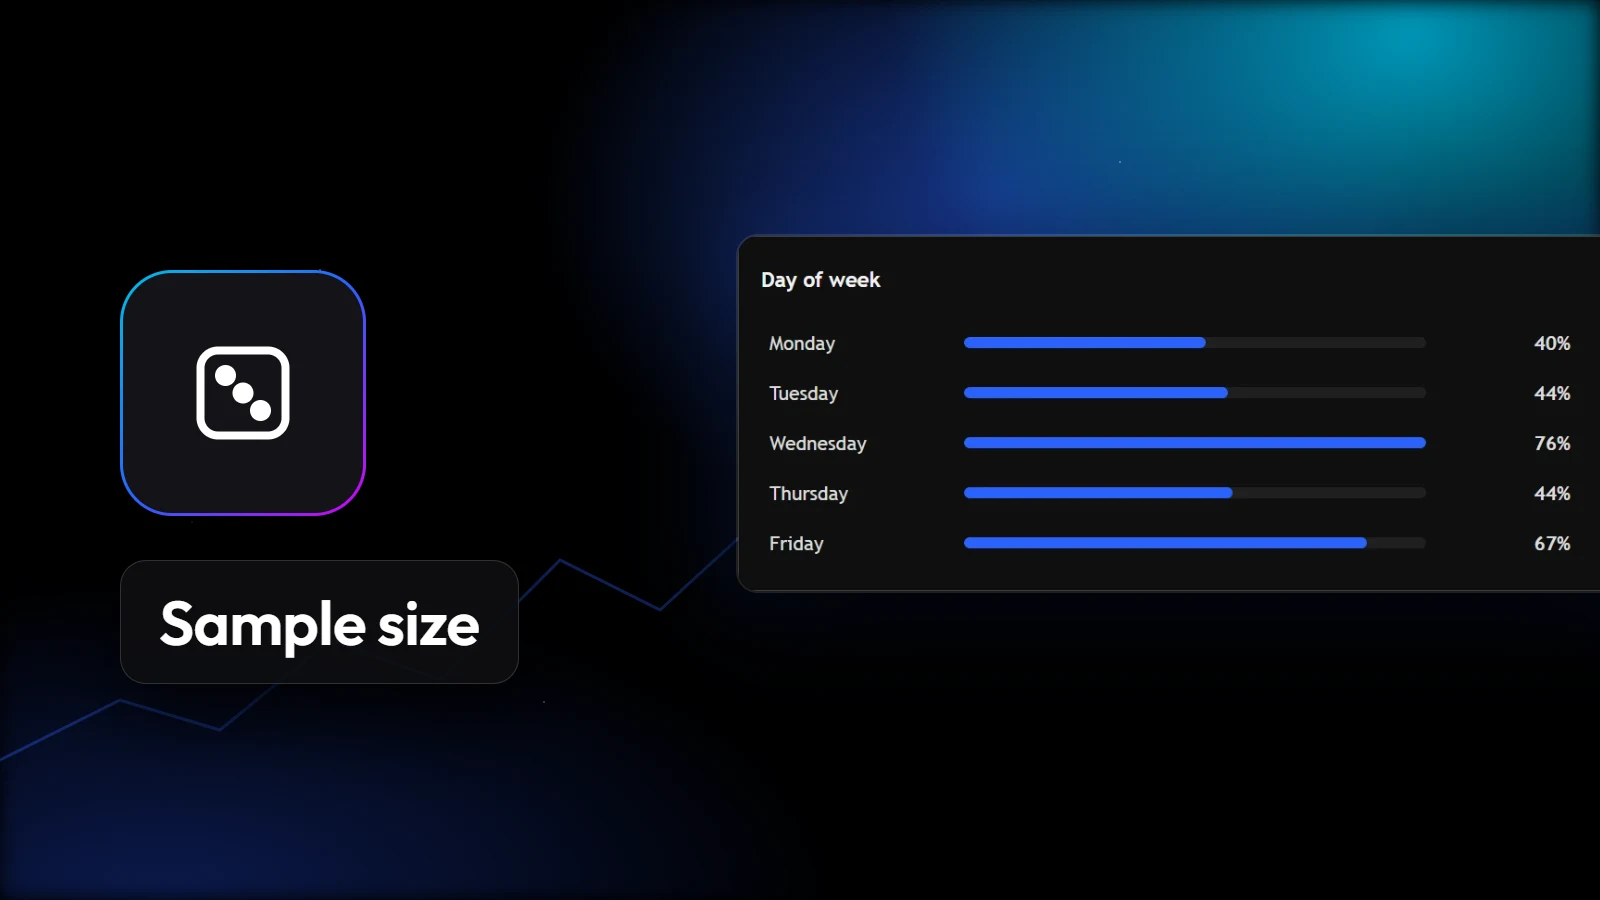 Measuring your edge
Your win rate is probably noise
A strategy with no edge at all shows 60% over twenty trades about one time in four. How many trades your figures need before they mean anything — and why expectancy settles sooner than win rate.
 Measuring your edge
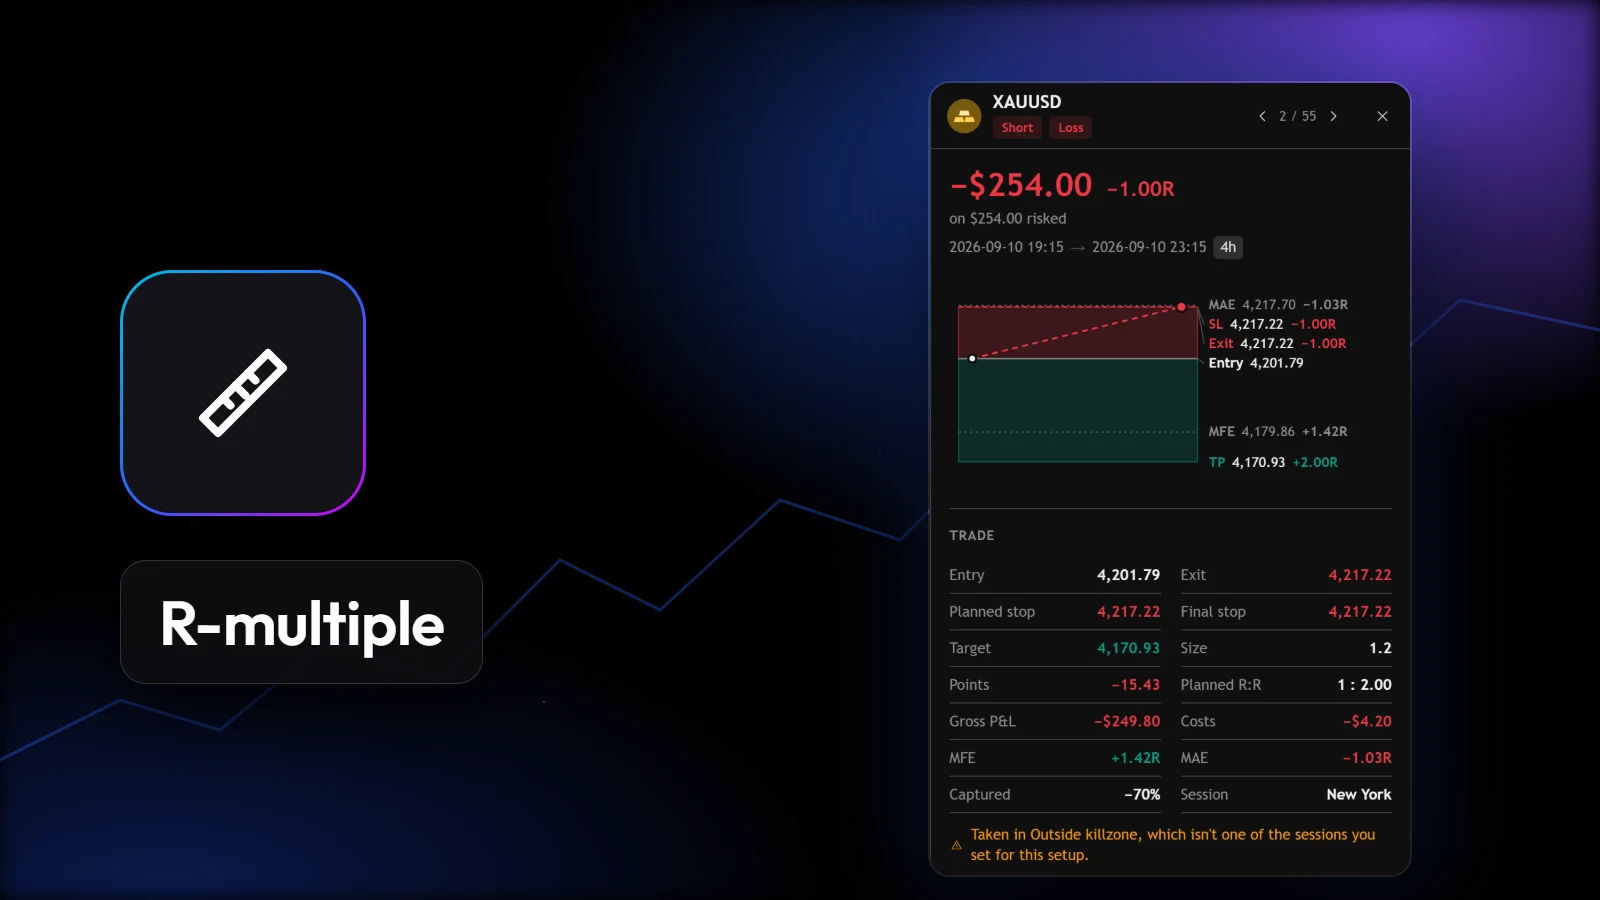
Moving your stop to breakeven breaks your R-multiple
Trailing a stop is good risk management. Dividing by the stop that survived is not: one $6.89 trade was scored at +172R and carried a whole account's average. The fix is the stop you opened with.
 Calculators
Run it on your own numbers.
They run in your browser and keep nothing. Start with the one most traders get wrong: how much a win rate is worth on the trades you actually have.
Run it on your own numbers.
They run in your browser and keep nothing. Start with the one most traders get wrong: how much a win rate is worth on the trades you actually have.
The range is the 95% confidence interval for a win rate: where the real figure sits, nineteen times in twenty.
Your real win rate is probably between
— and —
To pin it down to ±5 points you'd need about — trades.
The terms, in plain numbers.
Each with a worked example and the place in TradeAssay where you'll meet it.
R-multiple
A trade's result divided by what it risked at entry: the distance from entry to the stop you opened with, times the size. It puts a $40 trade and a $4,000 trade on the same scale.
Risked $150, made $300 → +2R · lost $150 → −1R
Why the opening stop mattersExpectancy
What an average trade is worth, in R: win rate times the average win, minus loss rate times the average loss. It is the number an edge actually is — win rate alone is half of it.
40% × 2.1R − 60% × 1R = +0.24R a trade
In ReportsProfit factor
Gross profit divided by gross loss. Above 1.0 the account grows, below it the account shrinks. Read it with the trade count beside it: 1.8 on twelve trades proves very little.
$9,000 won ÷ $6,000 lost = 1.5
In ReportsWin-rate range
The span your true win rate could sit in, given how many trades you have. Small samples give wide ranges, and a range that still includes 50% has not ruled out a coinflip.
18 wins in 30 → somewhere between 42% and 75%
How many trades you needMAE and MFE
Maximum adverse and favourable excursion: the worst and the best a trade went while it was open. A loser that was +1.8R first is an exit problem, not an entry problem.
MFE +1.8R · MAE −0.4R · closed −1R
In Trade ChartsDrawdown, static and trailing
The fall from a peak in equity to the low after it. Prop firms set the limit either from your starting balance (static) or from your highest point (trailing) — and a trailing floor moves up with you, never back down.
$100k account, $10k trailing → peak $105k, floor $95k
In Prop FirmDaily loss limit
The most an account may lose in one trading day, counted on the firm's clock rather than yours. Depending on the firm it is measured from balance or from equity, open trades included.
5% of $100k at 2% risk → two losses of room
The recovery trapDiscipline cost
What you made on the trades where you followed your playbook, set beside the trades where you broke it. The second number is what breaking the rules has cost so far — in dollars, not feelings.
Followed +$4,120 on 41 trades · broke −$2,380 on 17
In PlaybookShorter notes from the desk.
Your next trade deserves a reason.
Bring in your history and see what it says — free, in a few minutes.
Create your free accountAnswers to what traders ask us most — and a ticket to a person when they aren't enough.
Open helpsupport@tradeassay.com — read by the people who build the app.
Send an emailLong reads on sample size, R and prop-firm rules, each with a calculator.
Start reading