


Thirty-plus reports. One question: what actually pays you?
Performance, breakdowns, periods, comparisons, risk, discipline and execution. Every figure opens the trades it was built on, and every one tells you how many trades it stands on.
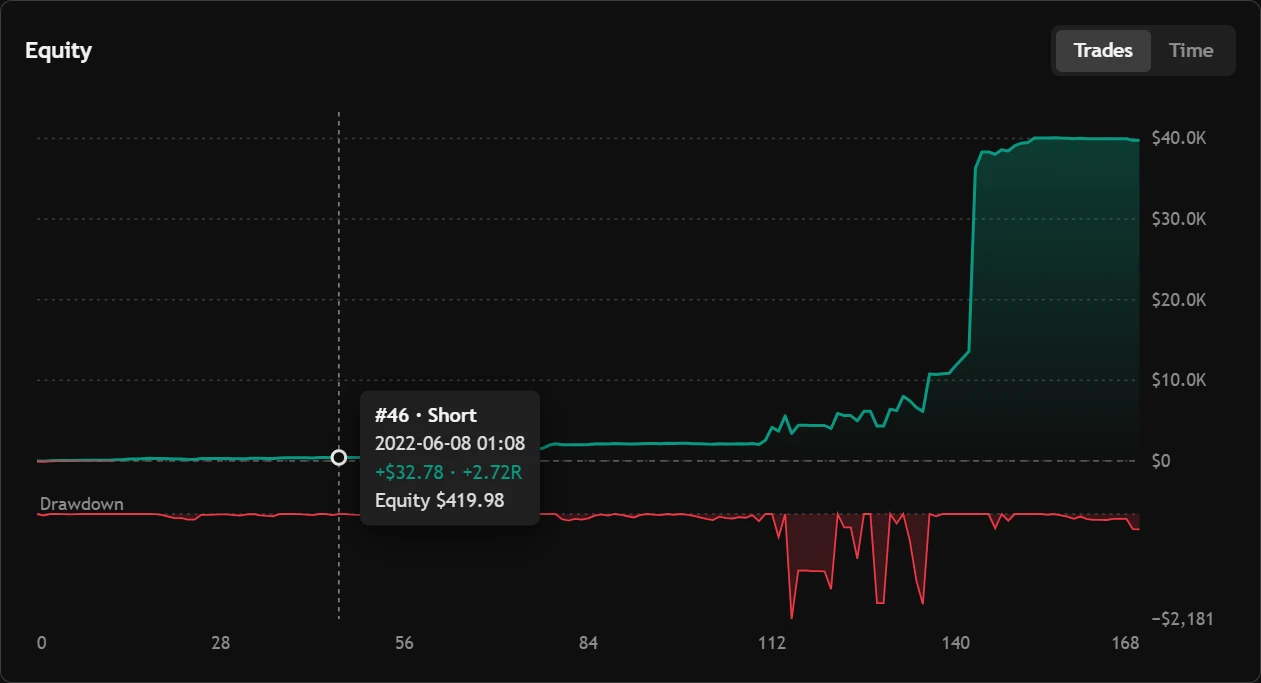

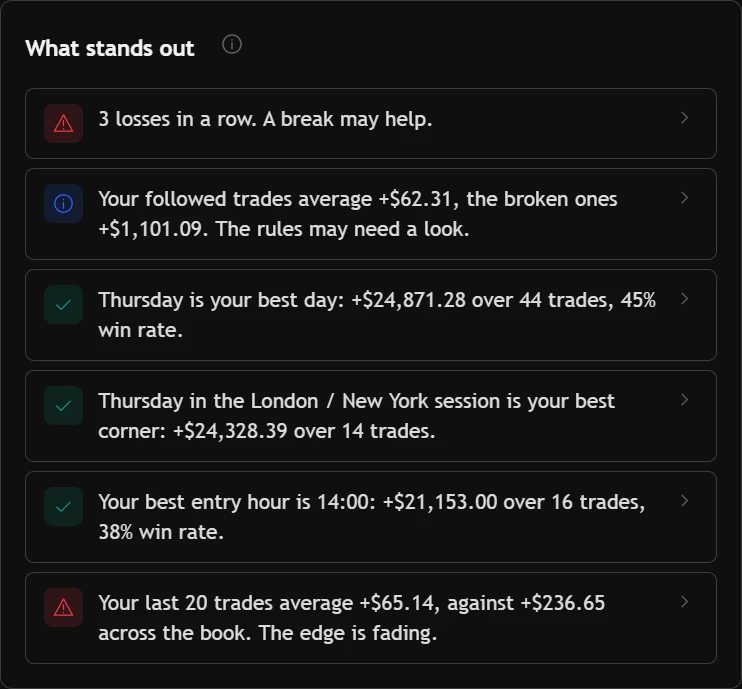
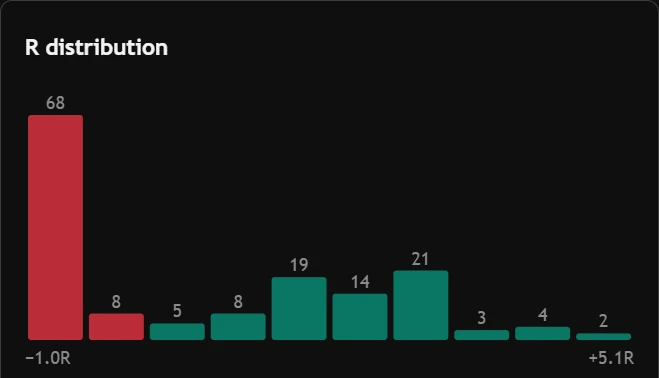
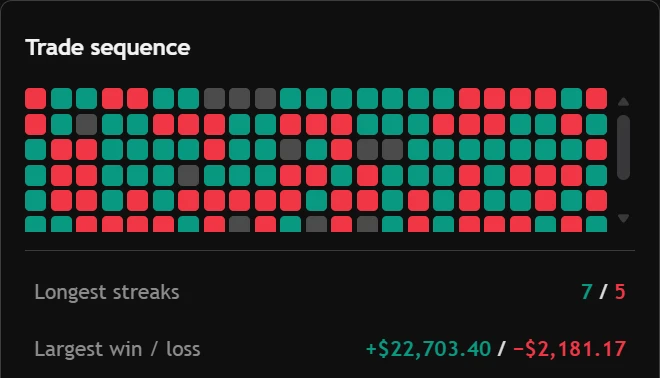
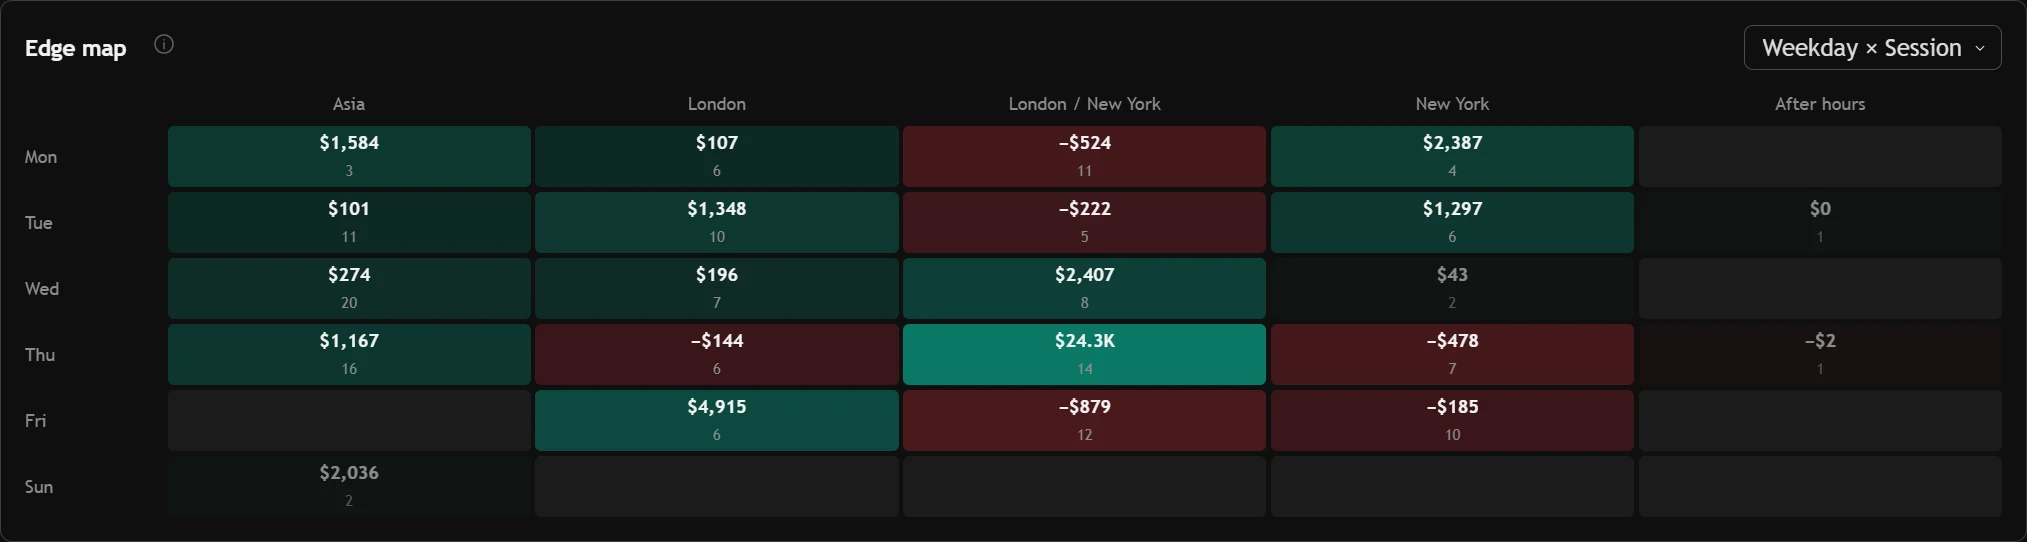
The edge map: when you make it, when you give it back.
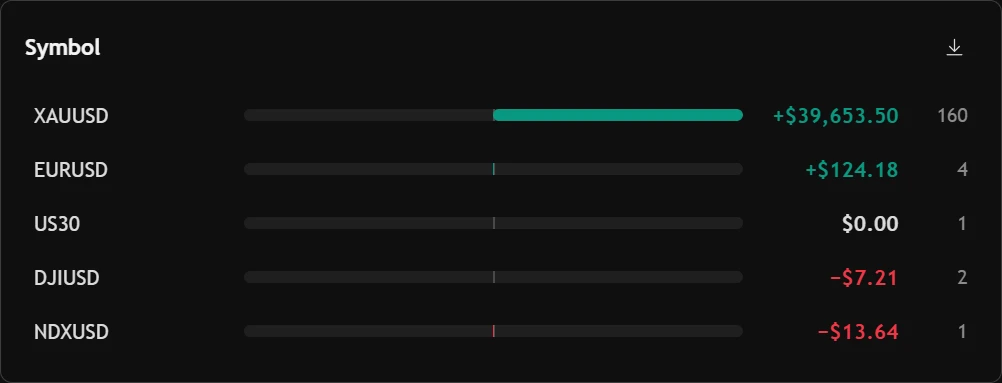
Weekday against entry hour, every cell coloured by the money it made or lost. Under it, the same split by symbol, side, session and killzone.
- Switch the map to win rate, average R, profit factor or trade count.
- Click a cell and the trades behind it open.
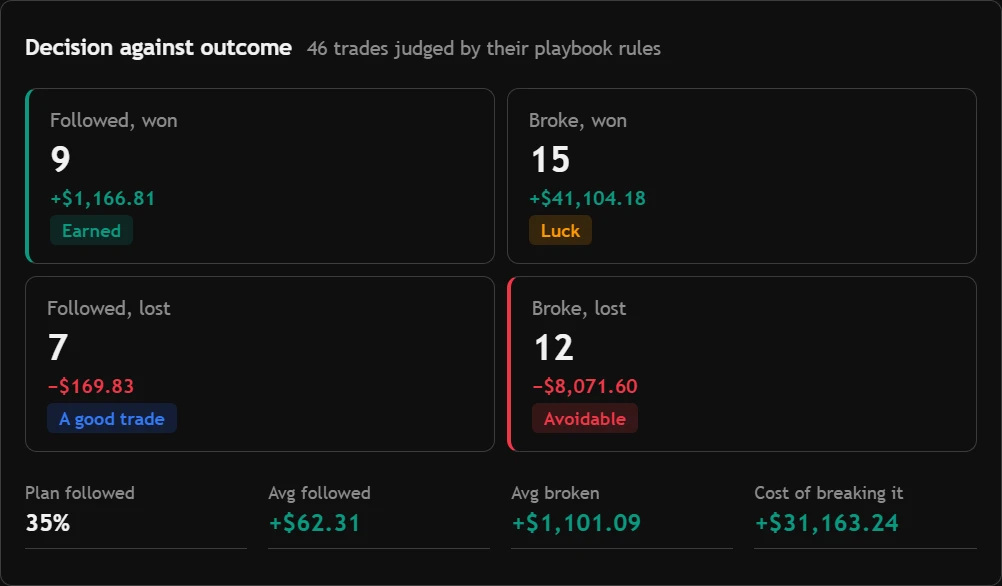
Separate a good decision from a lucky outcome.
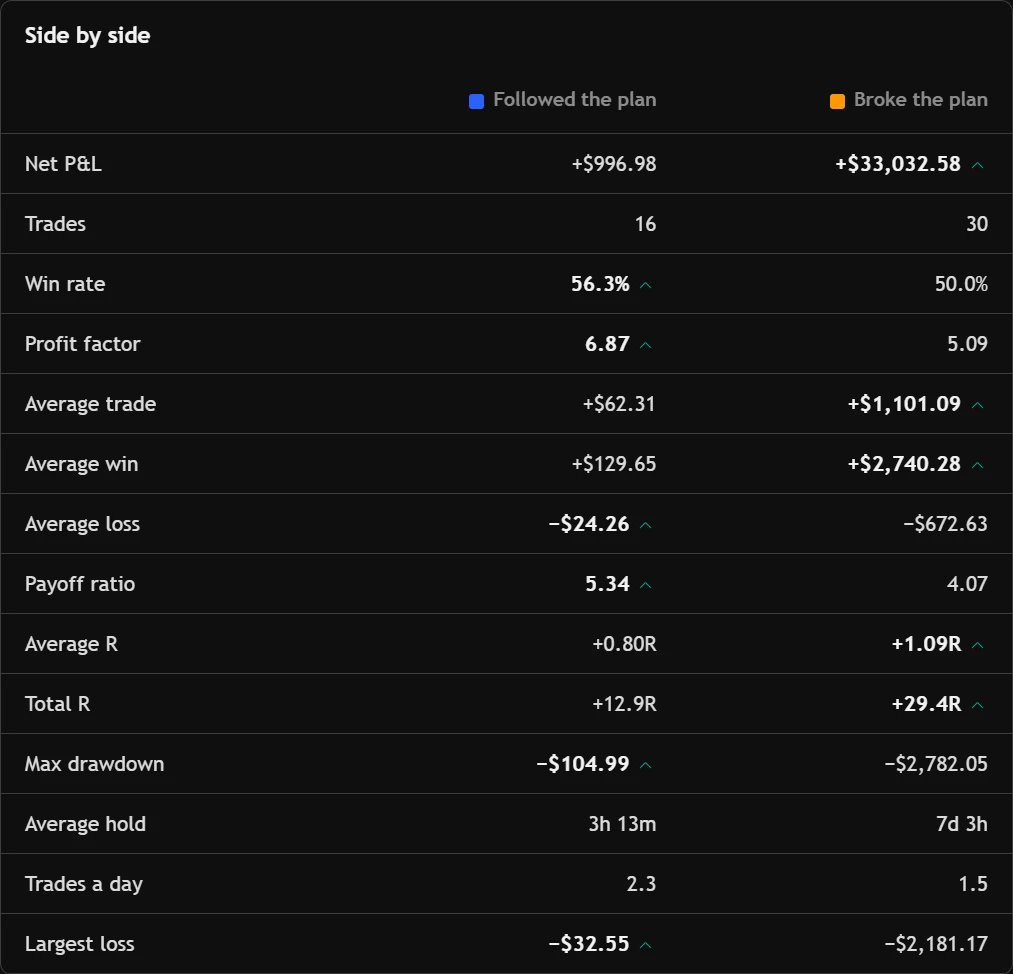
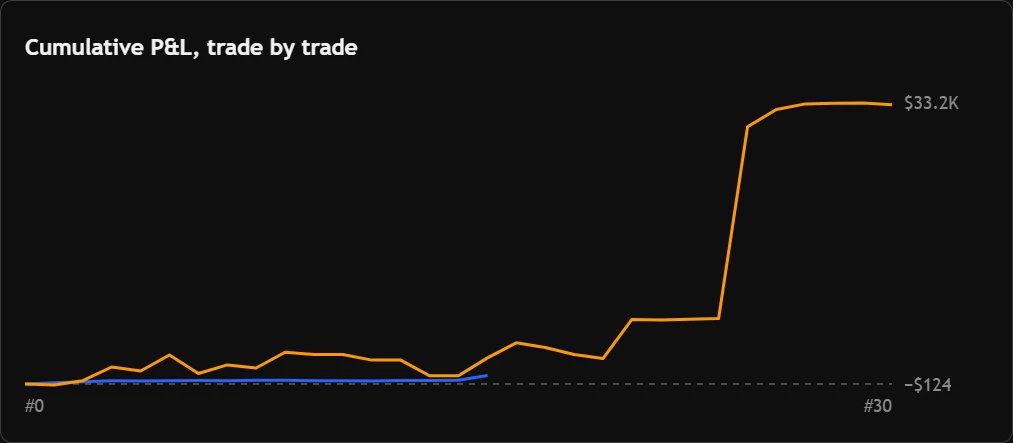
Every trade judged by its playbook lands in one of four boxes: followed and won, followed and lost, broke the rules and won, broke them and lost. The third box is luck. It is also the most expensive.
- What breaking the plan has cost you, in total and per trade.
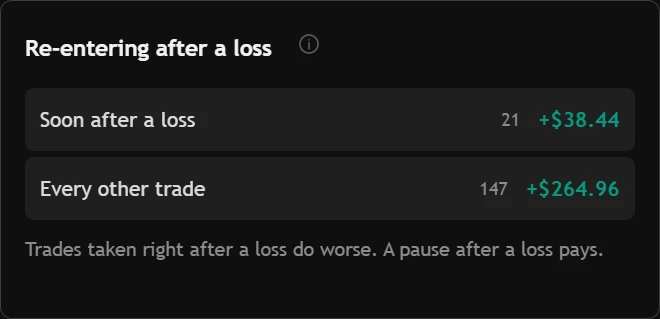
- Trades taken soon after a loss against every other trade.
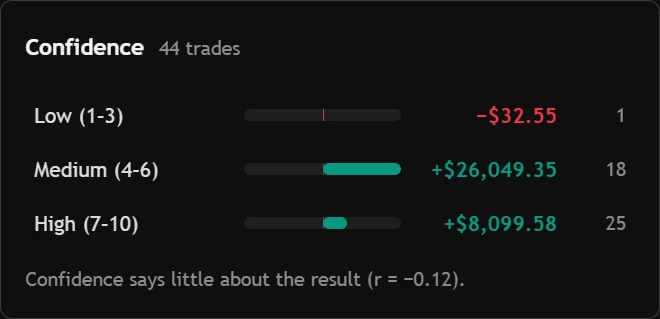
- Busy days against quiet ones, the first trade of the day against the fourth, and whether your confidence predicts anything.
The losing streak you should plan for — before it arrives.
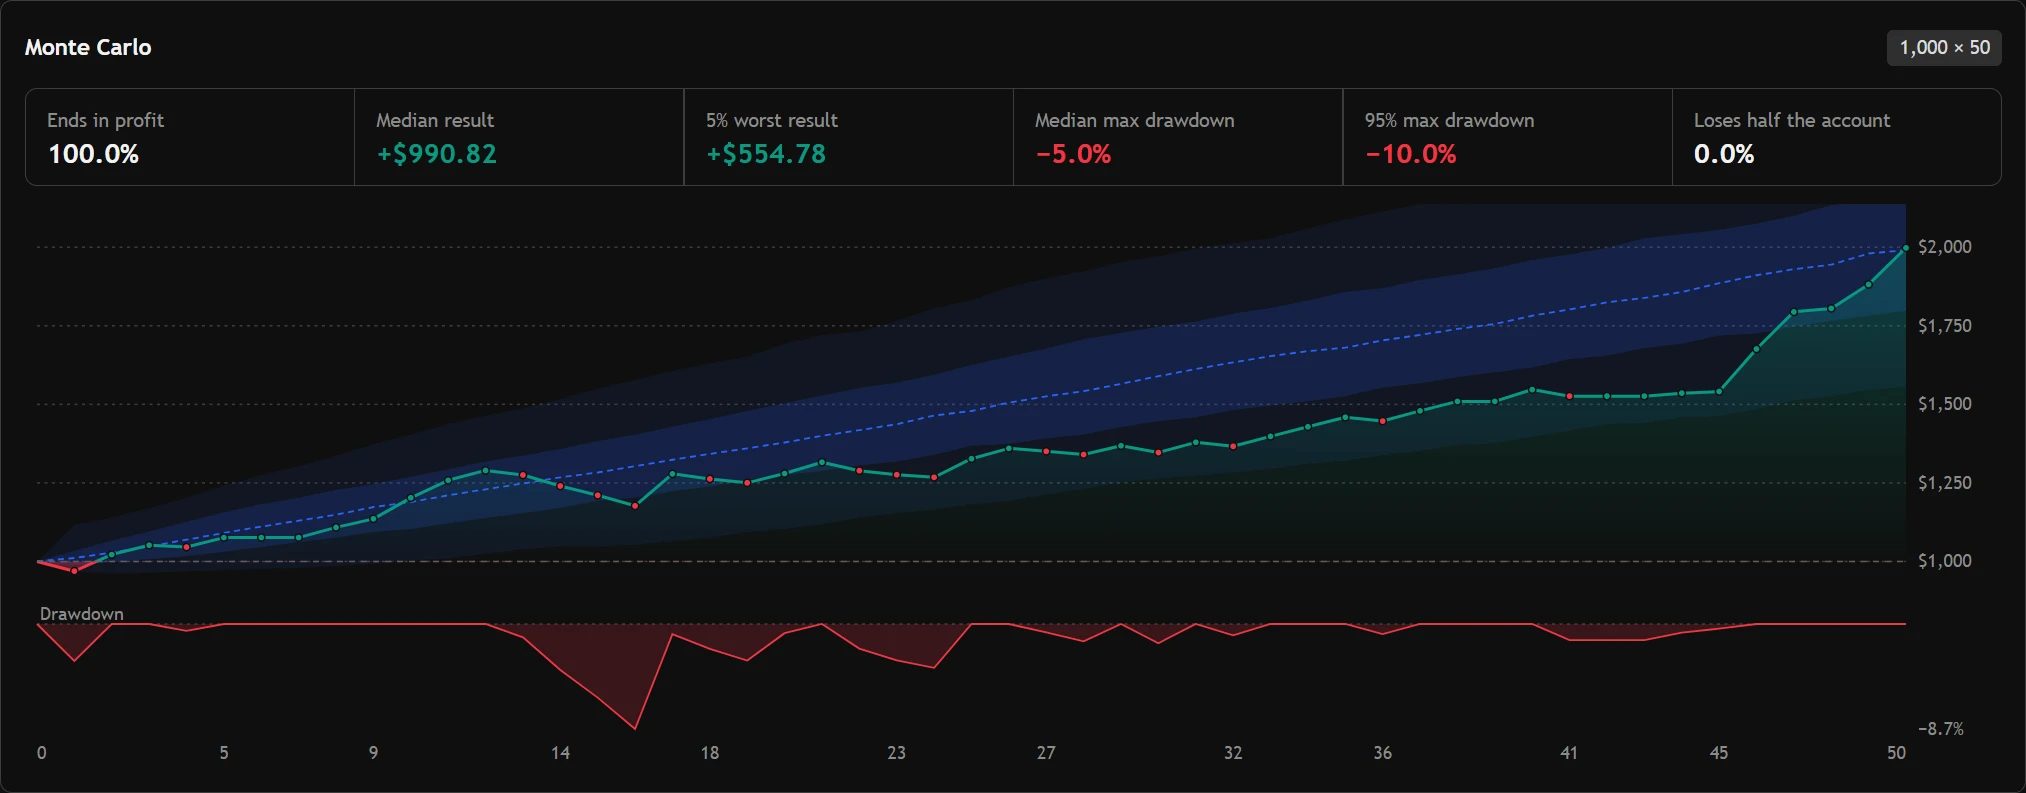
A Monte Carlo of your own trades, the money you really risk per trade and how much it varies, the longest runs, and the run of losses your win rate makes likely.
- Sharpe, Sortino, Calmar and recovery factor, worked out per trade.
- Every drawdown: from where, how deep, and how many trades it took to recover.
How much of the move you actually took home.
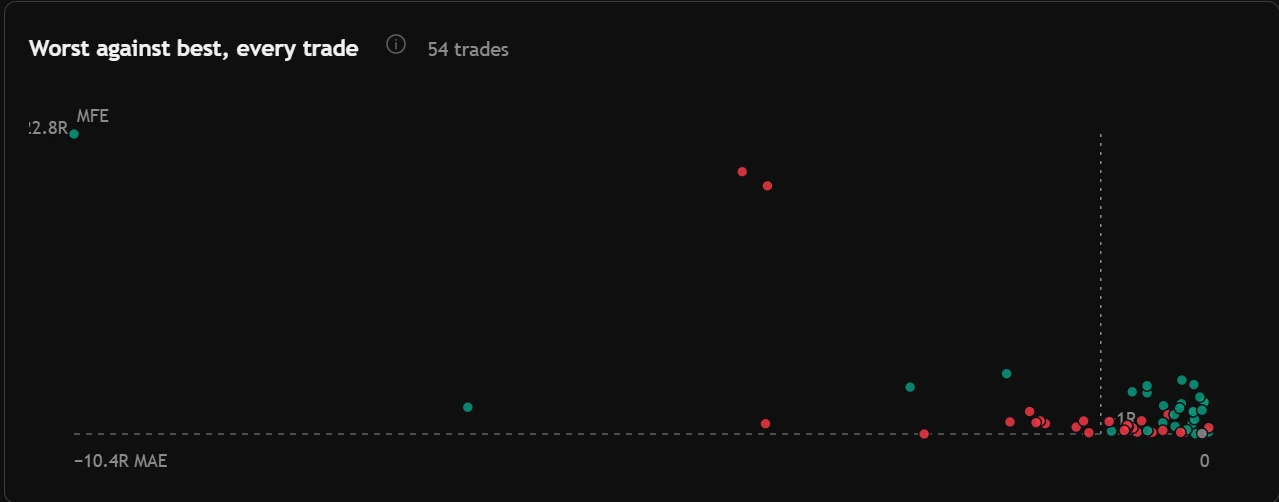
Move captured, R left on the table after the exit, winners given back, losers held longer than winners, and every trade plotted by how far it went against you and how far for you.
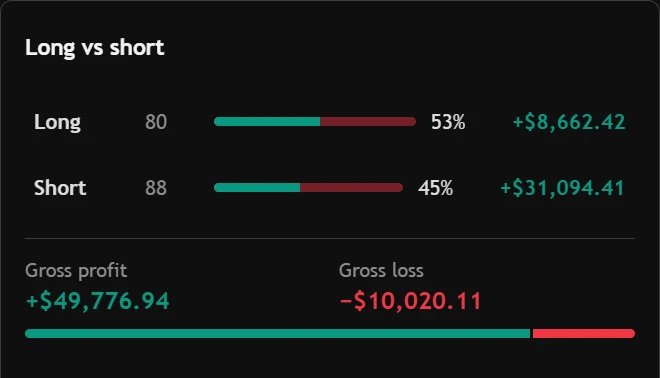
Long against short, line by line.
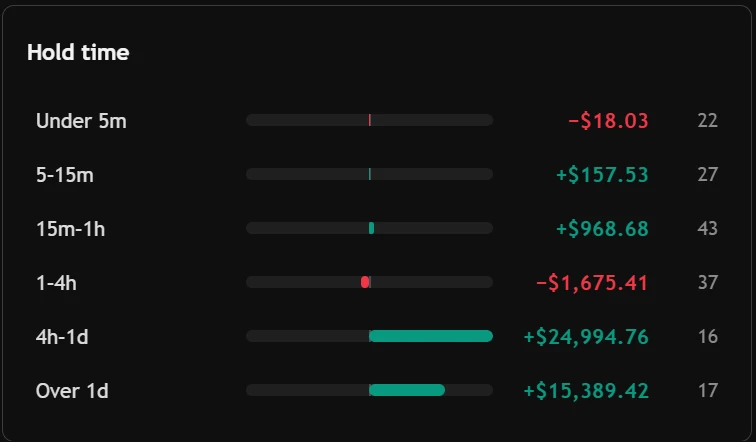
Net, gross, profit factor, expectancy in money and in R, averages, extremes, holding times and trades per day — for all trades, longs and shorts side by side. Weeks, months and years in the Periods report.

How many trades before your win rate means anything?
Thirty trades at 55% feels like an edge. Move the sliders and see the range your true win rate could be in — the same honesty check every report in the app carries.
The range is the 95% confidence interval for a win rate: where the real figure sits, nineteen times in twenty.
Your real win rate is probably between
— and —
To pin it down to ±5 points you'd need about — trades. Read why
Numbers that tell you what they stand on.
About the reports.
Do the reports work on imported trades?
Yes. Synced, imported and hand-entered trades all count the same. Trades with no stop recorded are counted apart from anything measured in R.
Do backtest trades mix with my live numbers?
No. Backtests live in their own practice account. Your live statistics stay clean, and the backtest still gets every report, chart and breakdown.
Which reports are on the free plan?
The overview and the core reports and breakdowns are free. The Periods report — weeks, months and years — and full-range export are part of Pro.
Turn a finding into a rule.
Your next trade deserves a reason.
Bring in your history and see what it says — free, in a few minutes.
Create your free accountAnswers to what traders ask us most — and a ticket to a person when they aren't enough.
Open helpsupport@tradeassay.com — read by the people who build the app.
Send an emailLong reads on sample size, R and prop-firm rules, each with a calculator.
Start reading