


How to backtest on TradingView, and what to do when Bar Replay isn't enough
Bar Replay and the Strategy Tester step by step, what each TradingView plan really allows, and what to use when it isn't enough.

The short answer
- Bar ReplayTrade the past by hand, bar by bar. Free on daily charts; intraday replay needs a paid plan.
- Strategy TesterRuns a coded Pine Script strategy and lists its trades, on the bars your chart loads (5,000 on the free plan).
- When that isn't enoughYears of 1-minute data, seconds, a journal of every trade, prop-firm rules: TradeAssay replays 762 symbols from 1 second to 12 months with your TradingView indicators, from $9.99 a month.
- Practise on daily charts, free
- Bar Replay
- Test a coded strategy
- Strategy Tester
- See what each plan allows
- Plans table
- Bar Replay greyed out or stuck
- Fixes
- Intraday replay with years of history
- Alternatives
- Your Pine scripts on a replay, with a journal
- TradeAssay
Who wrote this. TradeAssay makes a backtester, and it is one of the alternatives below. Every TradingView fact on this page comes from TradingView's own help and pricing pages, read on 21 November 2026, with a link to the page it came from. Plans and prices change; check TradingView's pricing page before you buy.
The two ways to backtest on TradingView
| Bar Replay | Strategy Tester | |
|---|---|---|
| What it is | The chart rewinds to a past bar and plays forward one bar at a time, with the future hidden | A Pine Script strategy runs over the bars on the chart and lists every trade it would have taken |
| You need | A rule you can follow by eye, and somewhere to write each trade down | Your rules written as a Pine Script strategy |
| Good for | Discretionary traders: practising entries, exits and patience on real price | Rules that can be coded: moving-average crosses, breakouts, indicator signals |
| Watch out for | Intraday replay depends on your plan, and the results are not kept as a journal | It only tests the bars your chart loads, and fills are worked out on bars, not ticks |
How to backtest with Bar Replay, step by step
These are the steps in TradingView's own guide, Bar Replay: how and why to test a strategy in the past.
- Open the chart. Pick the symbol and the timeframe you trade. On the free plan only daily, weekly and monthly charts can be replayed.
- Start Bar Replay. Click Bar replay on the chart's top panel, the button that looks like a video rewind button. A blue vertical line with scissors follows your mouse.
- Pick the starting bar. Click the bar to start from, or use the replay panel's Select date, Select the first available day or Random bar. A random start keeps you from choosing a period you already remember.
- Play, or step one bar at a time. Press Play, or Forward for a single bar. Shortcuts: Shift + → steps forward, Shift + ↓ starts and stops playback. The speed can be changed before or during playback.
- Trade it, and write every trade down. Place your orders as the bars arrive. TradingView shows a replay session's result when it ends, but it is not kept as a journal, so record each trade yourself: entry, stop, target, result in R and the reason you took it.
- Go back to the live chart. Click Jump to real-time chart, or close the panel. A layout with several charts can replay one chart or all of them, kept in time with each other.
Tip: to reach older 1-minute bars than the 1-minute chart lets you pick, select the starting bar on the daily chart, then switch to 1-minute and press Play. It still stops at your plan's limit.
How to backtest a Pine Script strategy in the Strategy Tester
- Get a strategy on the chart. Open Indicators and pick one of the built-in strategies, or
open the Pine Editor, write or paste a script that starts with
strategy(), and click Add to chart. - Set its properties. In the strategy's settings, set the initial capital, the order size, the commission and the slippage. A backtest without costs flatters almost every strategy, most of all on low timeframes.
- Read the Strategy Report. The Strategy Tester panel under the chart shows the metrics and the list of trades, as TradingView's guide to strategies and backtesting describes.
- Check how much history it covered. The test runs on the bars loaded on the chart: 5,000 on Basic, 10,000 on Essential and Plus, 20,000 on Premium and 40,000 on Ultimate (TradingView's pricing page). On a market that trades around the clock, 5,000 one-minute bars are about three and a half days, far too few to judge a strategy.
- Be suspicious of a perfect curve. Fills are worked out on bars, so a stop and a target inside the same bar need an assumption about which came first; a script that requests a higher timeframe can look into bars that hadn't closed yet. Test on a period you didn't use to build the rules.
What each TradingView plan allows for backtesting
From TradingView's pricing page and How much data is available for Bar Replay?, read on 21 November 2026. Prices are per month, billed yearly, as the pricing page showed them that day (it marked them as special prices).
| Plan | Price | Bar Replay, 1-minute history | Seconds | Ticks | Bars on the chart | Indicators per chart |
|---|---|---|---|---|---|---|
| Basic | Free | None: daily and higher only | No | No | 5,000 | 2 |
| Essential | $12.95 | 180 days (30 months on 5-minute, 90 months on 15-minute) | No | No | 10,000 | 5 |
| Plus | $29.95 | 365 days (5 years on 5-minute, 15 years on 15-minute) | No | No | 10,000 | 10 |
| Premium | $59.95 | All of the symbol's history | Yes, from August 2022 | No | 20,000 | 25 |
| Ultimate | $199.95 | All of the symbol's history | Yes, from August 2022 | Last 7 days | 40,000 | 50 |
Daily and higher timeframes replay the symbol's whole history on every plan. Continuous futures charts such as ES1! have their own, shorter limits: six months of 1-minute bars on Essential, one year on Plus and above, and 30 days of seconds on Premium and above.
Bar Replay not working? The usual reasons
- The intraday timeframes are greyed out. The free Basic plan replays daily and higher timeframes only; intraday replay starts on Essential.
- "Data point unavailable". You switched to a lower timeframe that has no data at the replay point, usually because it is older than your plan's limit. The chart keeps the timeframe it had.
- It jumps to a later date than you picked. The starting point was older than the data; Bar Replay moves to the first available bar.
- The button is missing on some charts. Renko, Kagi, Point & Figure, Range, Line Break, Volume footprint and Time Price Opportunity charts can't be replayed, and neither can spread or tick-based charts.
- Alerts don't fire. New server-side alerts can't be created during a replay, and the regression trend and fixed range volume profile tools are inactive.
When Bar Replay isn't enough
Bar Replay is a good way to practise, and it costs nothing on daily charts. Traders usually outgrow it for one of four reasons: they trade intraday and need years of 1-minute or seconds history without paying for TradingView Premium; they want real spreads and costs on every fill; they want each practice trade kept and measured (win rate, R, by setup and session) instead of a result that disappears with the session; or they are preparing for a prop-firm challenge and want its daily loss and drawdown rules checked as they trade. These are the main options.
| TradingView Premium | TradeAssay | FX Replay | Forex Tester Online | |
|---|---|---|---|---|
| Paid from | $59.95/mo, billed yearly | $9.99/mo or $79.99/yr | $17.99/mo or $180/yr | Yearly or lifetime plans, priced in your local currency |
| Free to try | Basic: daily replay | 2 sessions of 5 trades on 10 symbols | 2 sessions of 50 trades, 1 indicator | A free demo |
| History | All of the symbol's history | 762 symbols; forex and gold in 1-minute bars since 2003 | Forex from 2003, futures from 2012 (its FAQ) | Up to 23 years of tick data |
| Timeframes | Seconds data from August 2022 | 1 second to 12 months (seconds on Elite) | Seconds and CME futures on Pro ($35/mo) | 1 minute and up; no seconds yet |
| Your TradingView scripts | Yes, it is TradingView | Yes: Pine v5 and v6 indicators and strategies | Not stated | Not stated (its own indicators, 95 built-in) |
| Journal of backtest trades | No; a report for coded strategies | Yes, every trade, with full analysis | Yes, for its backtest sessions | Yes |
| Prop-firm rules | No | Yes: a challenge simulator with firms' rules | Not listed on its pricing page | On its Pro plan |
FX Replay's facts are from its pricing page and FAQ, checked on 7 November 2026 (see our FX Replay comparison); Forex Tester Online's from its own home page on 21 November 2026. "Not stated" means the vendor's page didn't say.
How to backtest on TradeAssay, step by step
TradeAssay is a trading journal with a bar-by-bar backtester built in. It is ours, so here is exactly what it does and doesn't.

1. Create a backtest session
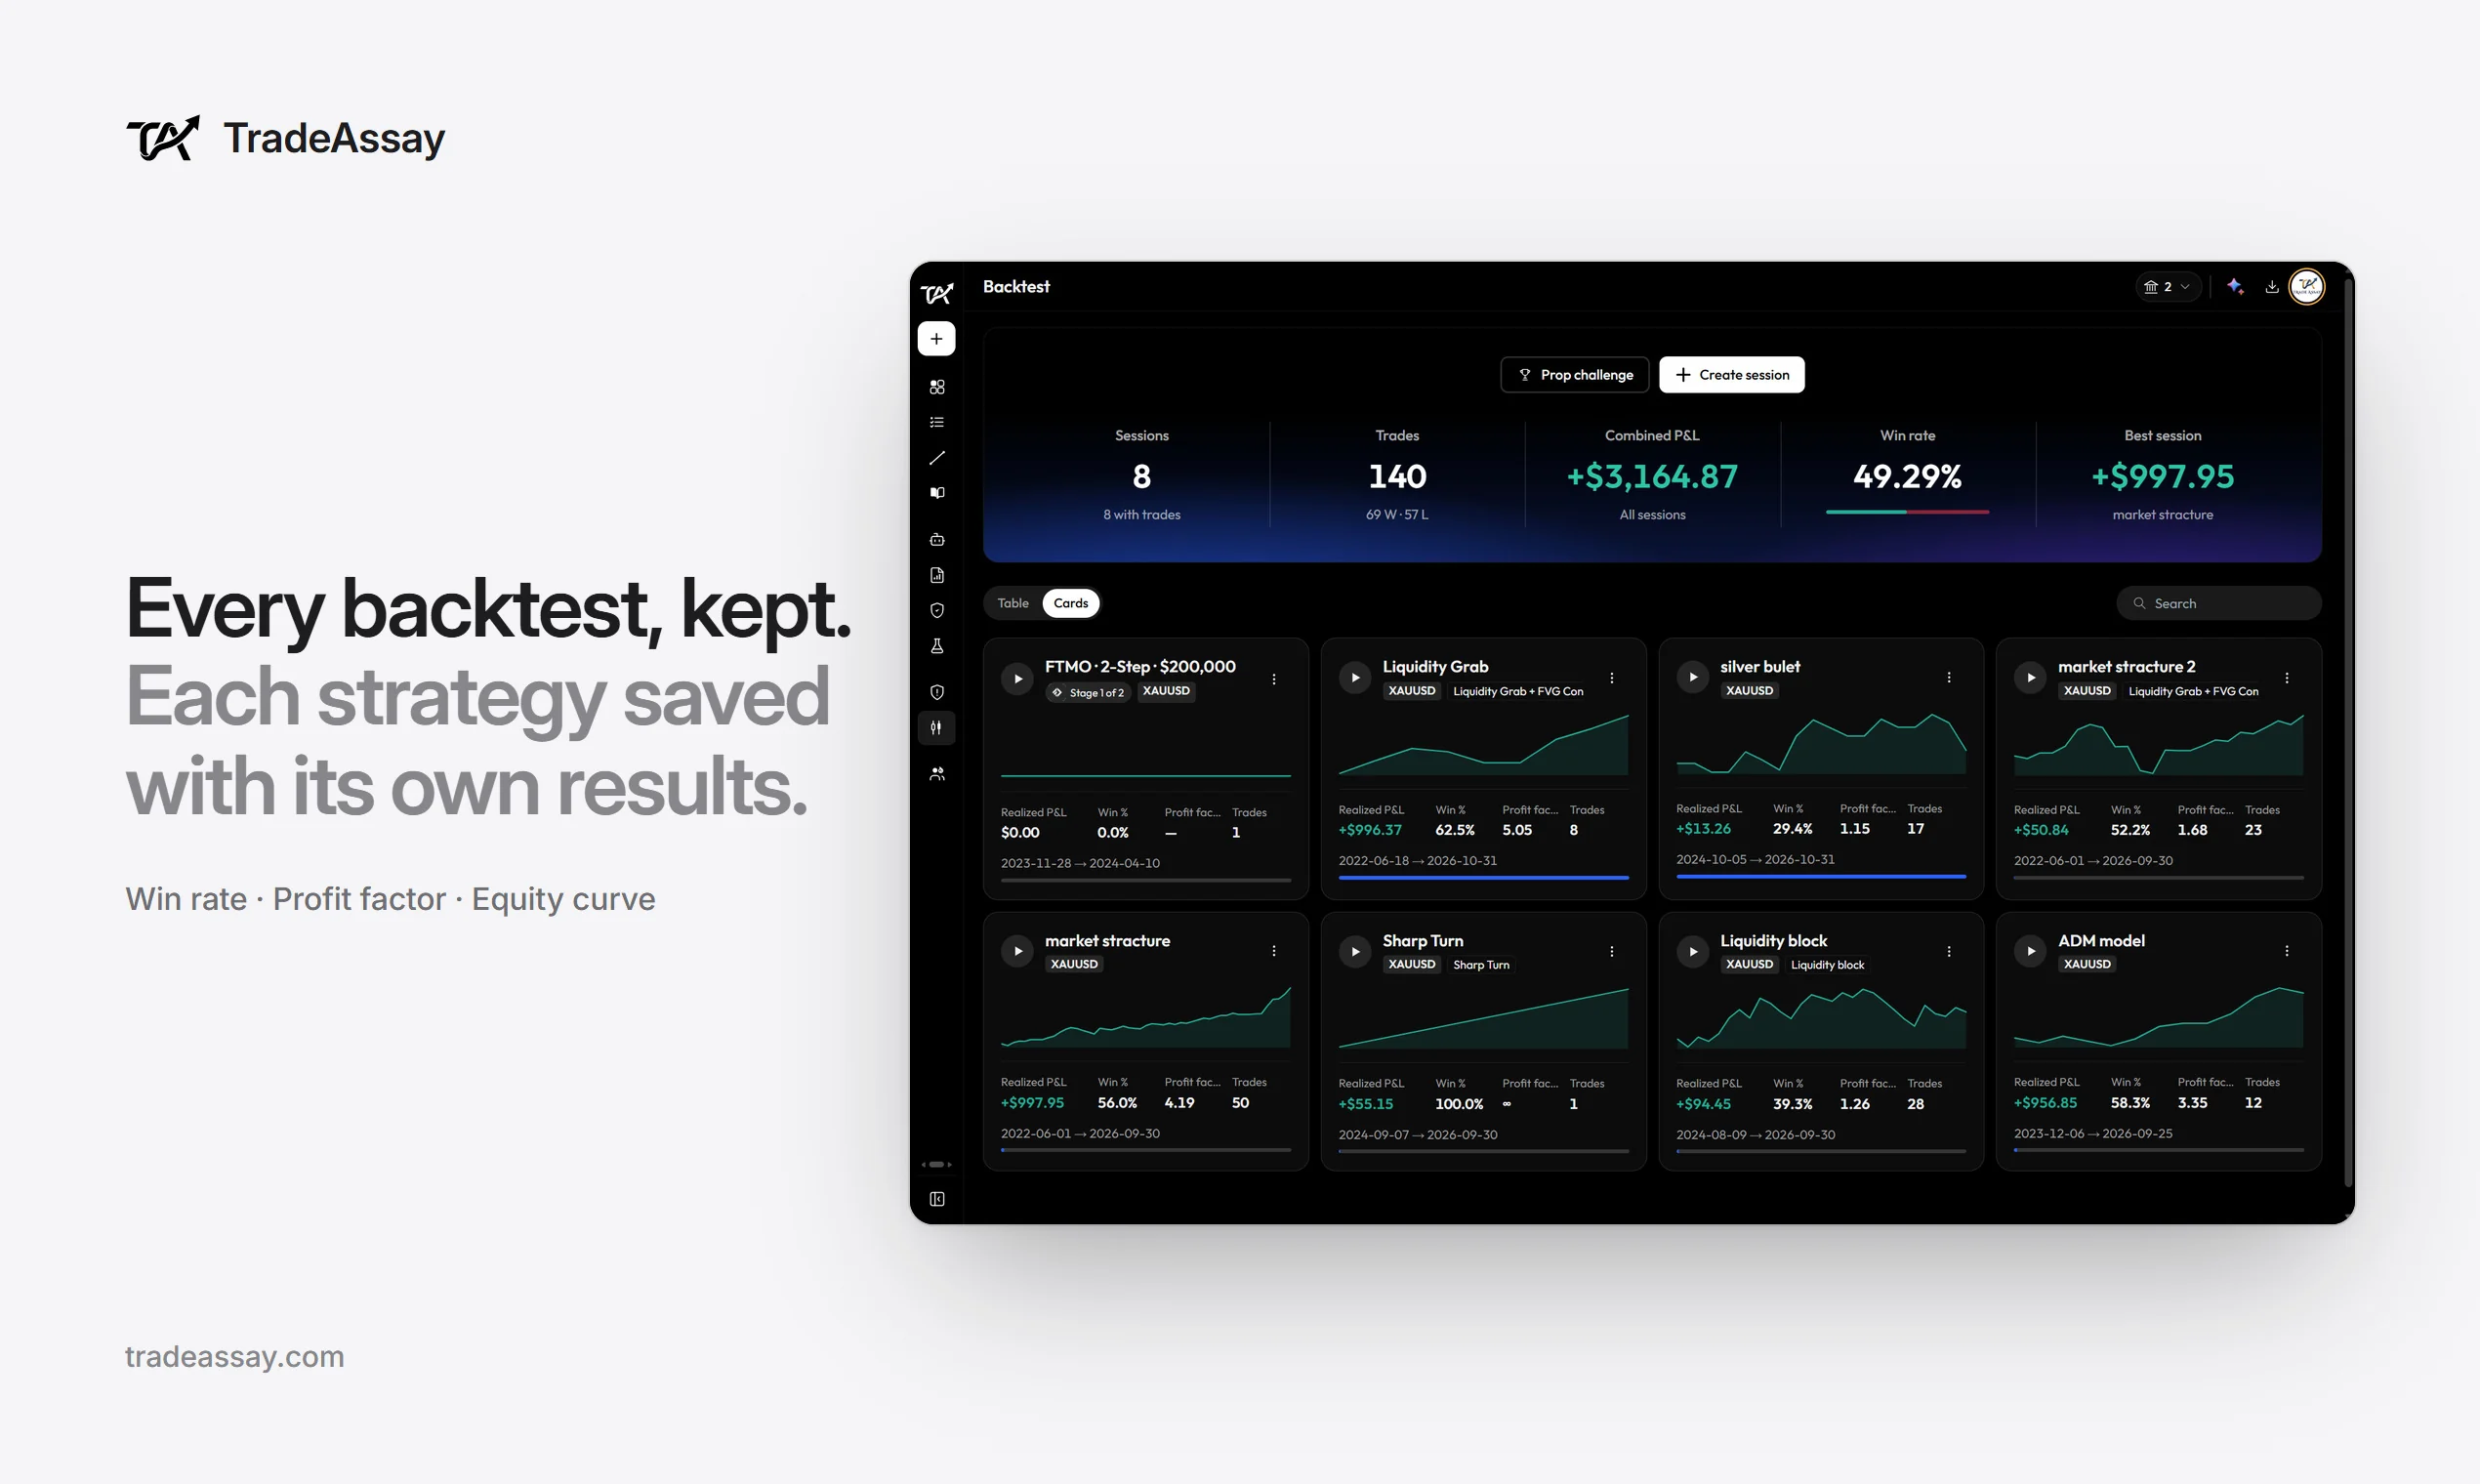
Give it a name, a starting balance and a start date. Each session is its own account, so backtest trades never mix with your live results, and every session keeps its own statistics.
2. Pick a symbol
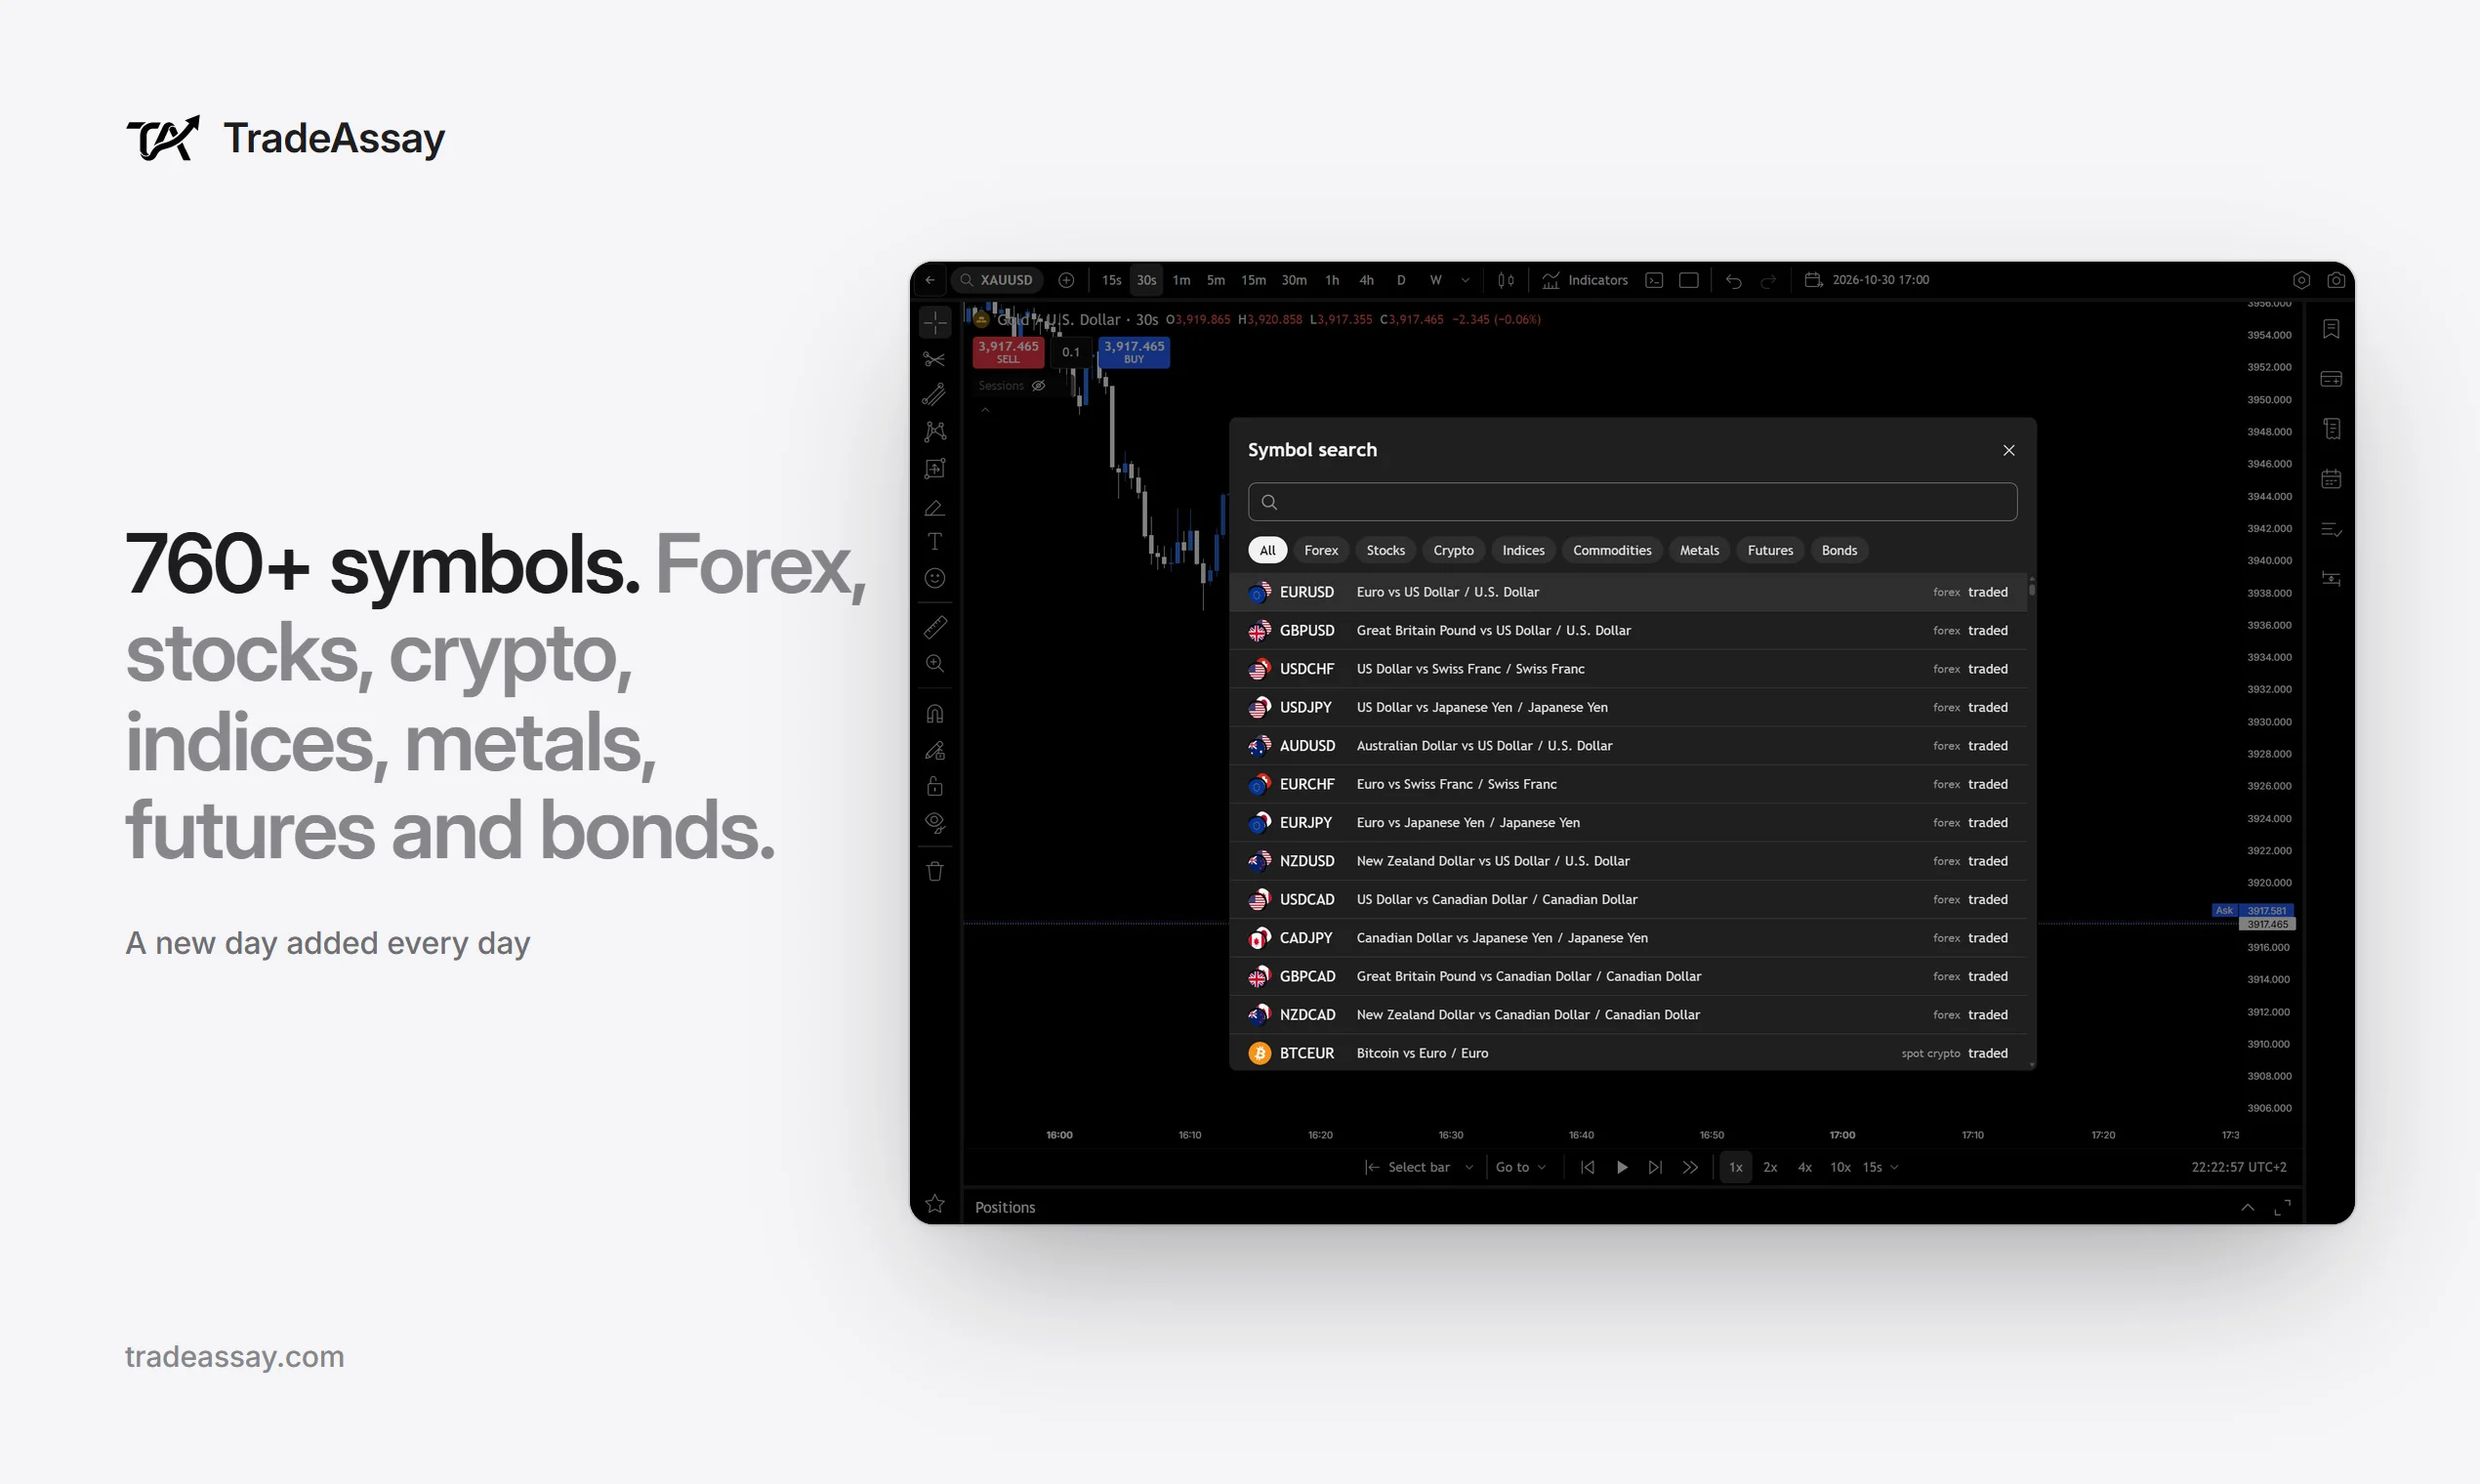
762 symbols of real historical prices: forex, metals, indices, commodities, bonds, stocks, 12 CME futures and 431 crypto pairs. Pro opens 750 of them; the CME futures are on Elite. See every symbol.
3. Choose the timeframe, from 1 second to 12 months
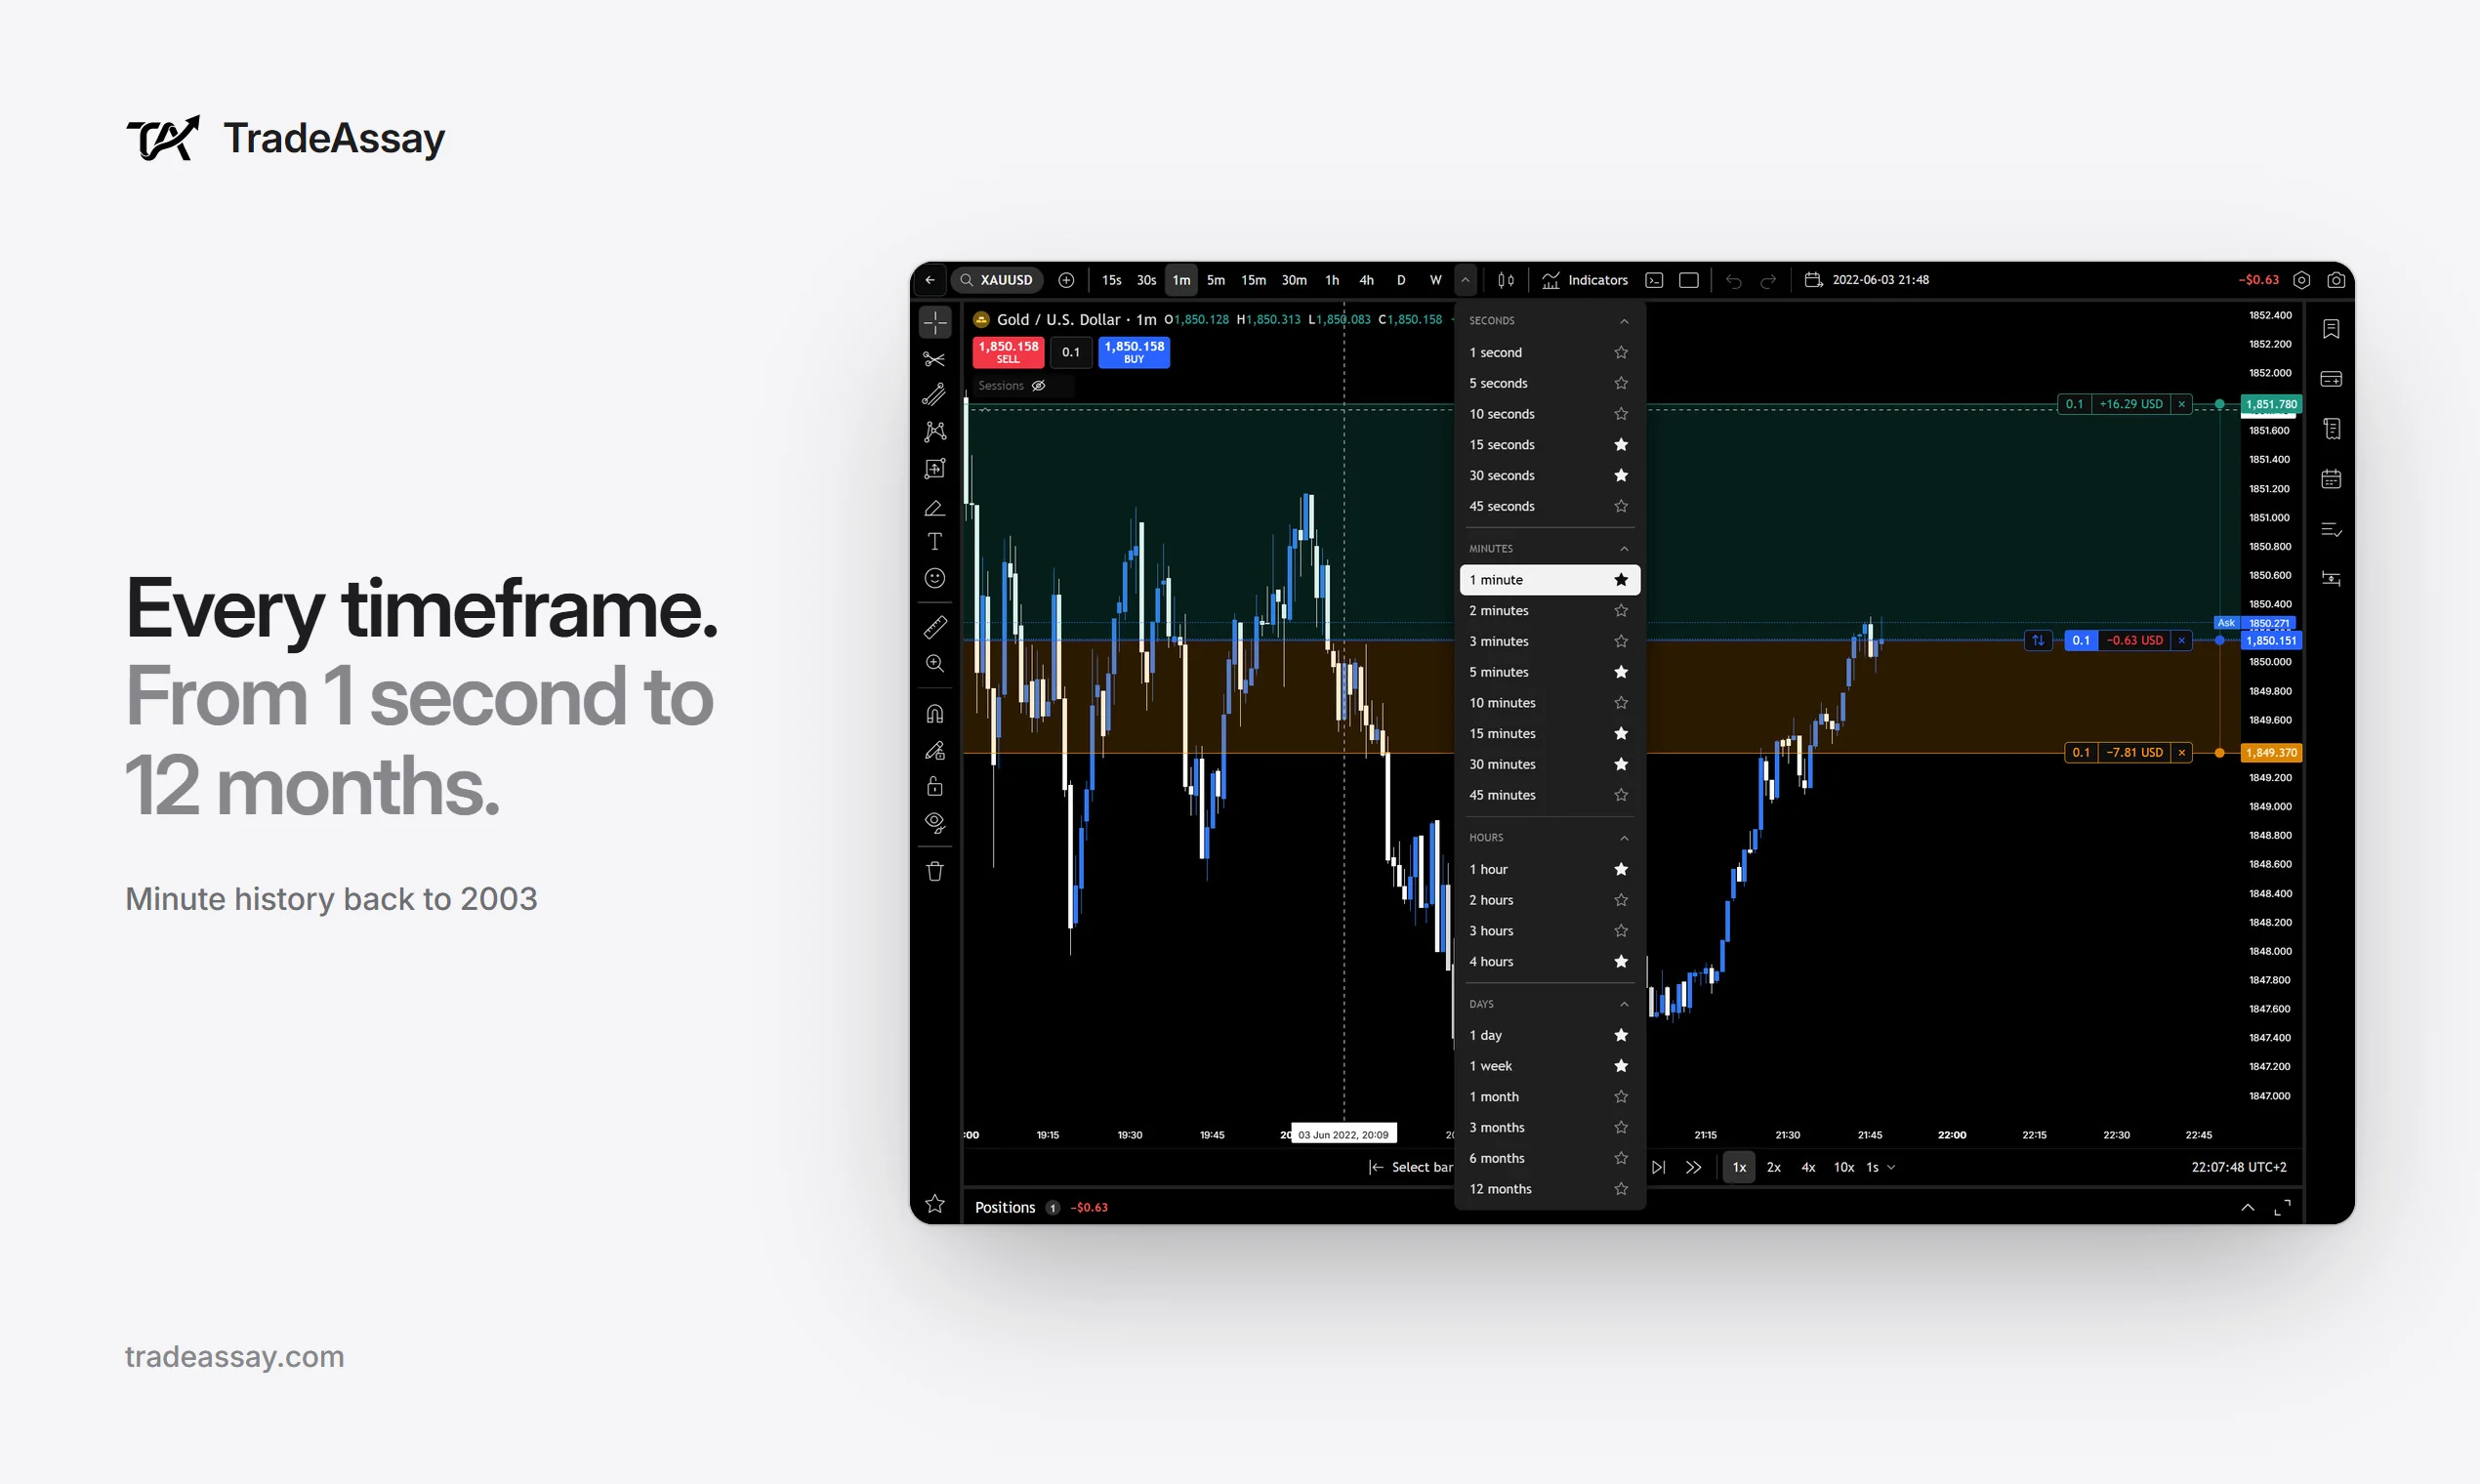
24 timeframes, the same list as TradingView's. Seconds charts are on Elite, for the 188 symbols with real seconds data; a finer bar is never invented from a coarser one. You can switch timeframe in the middle of a replay.
4. Add your TradingView indicator or strategy
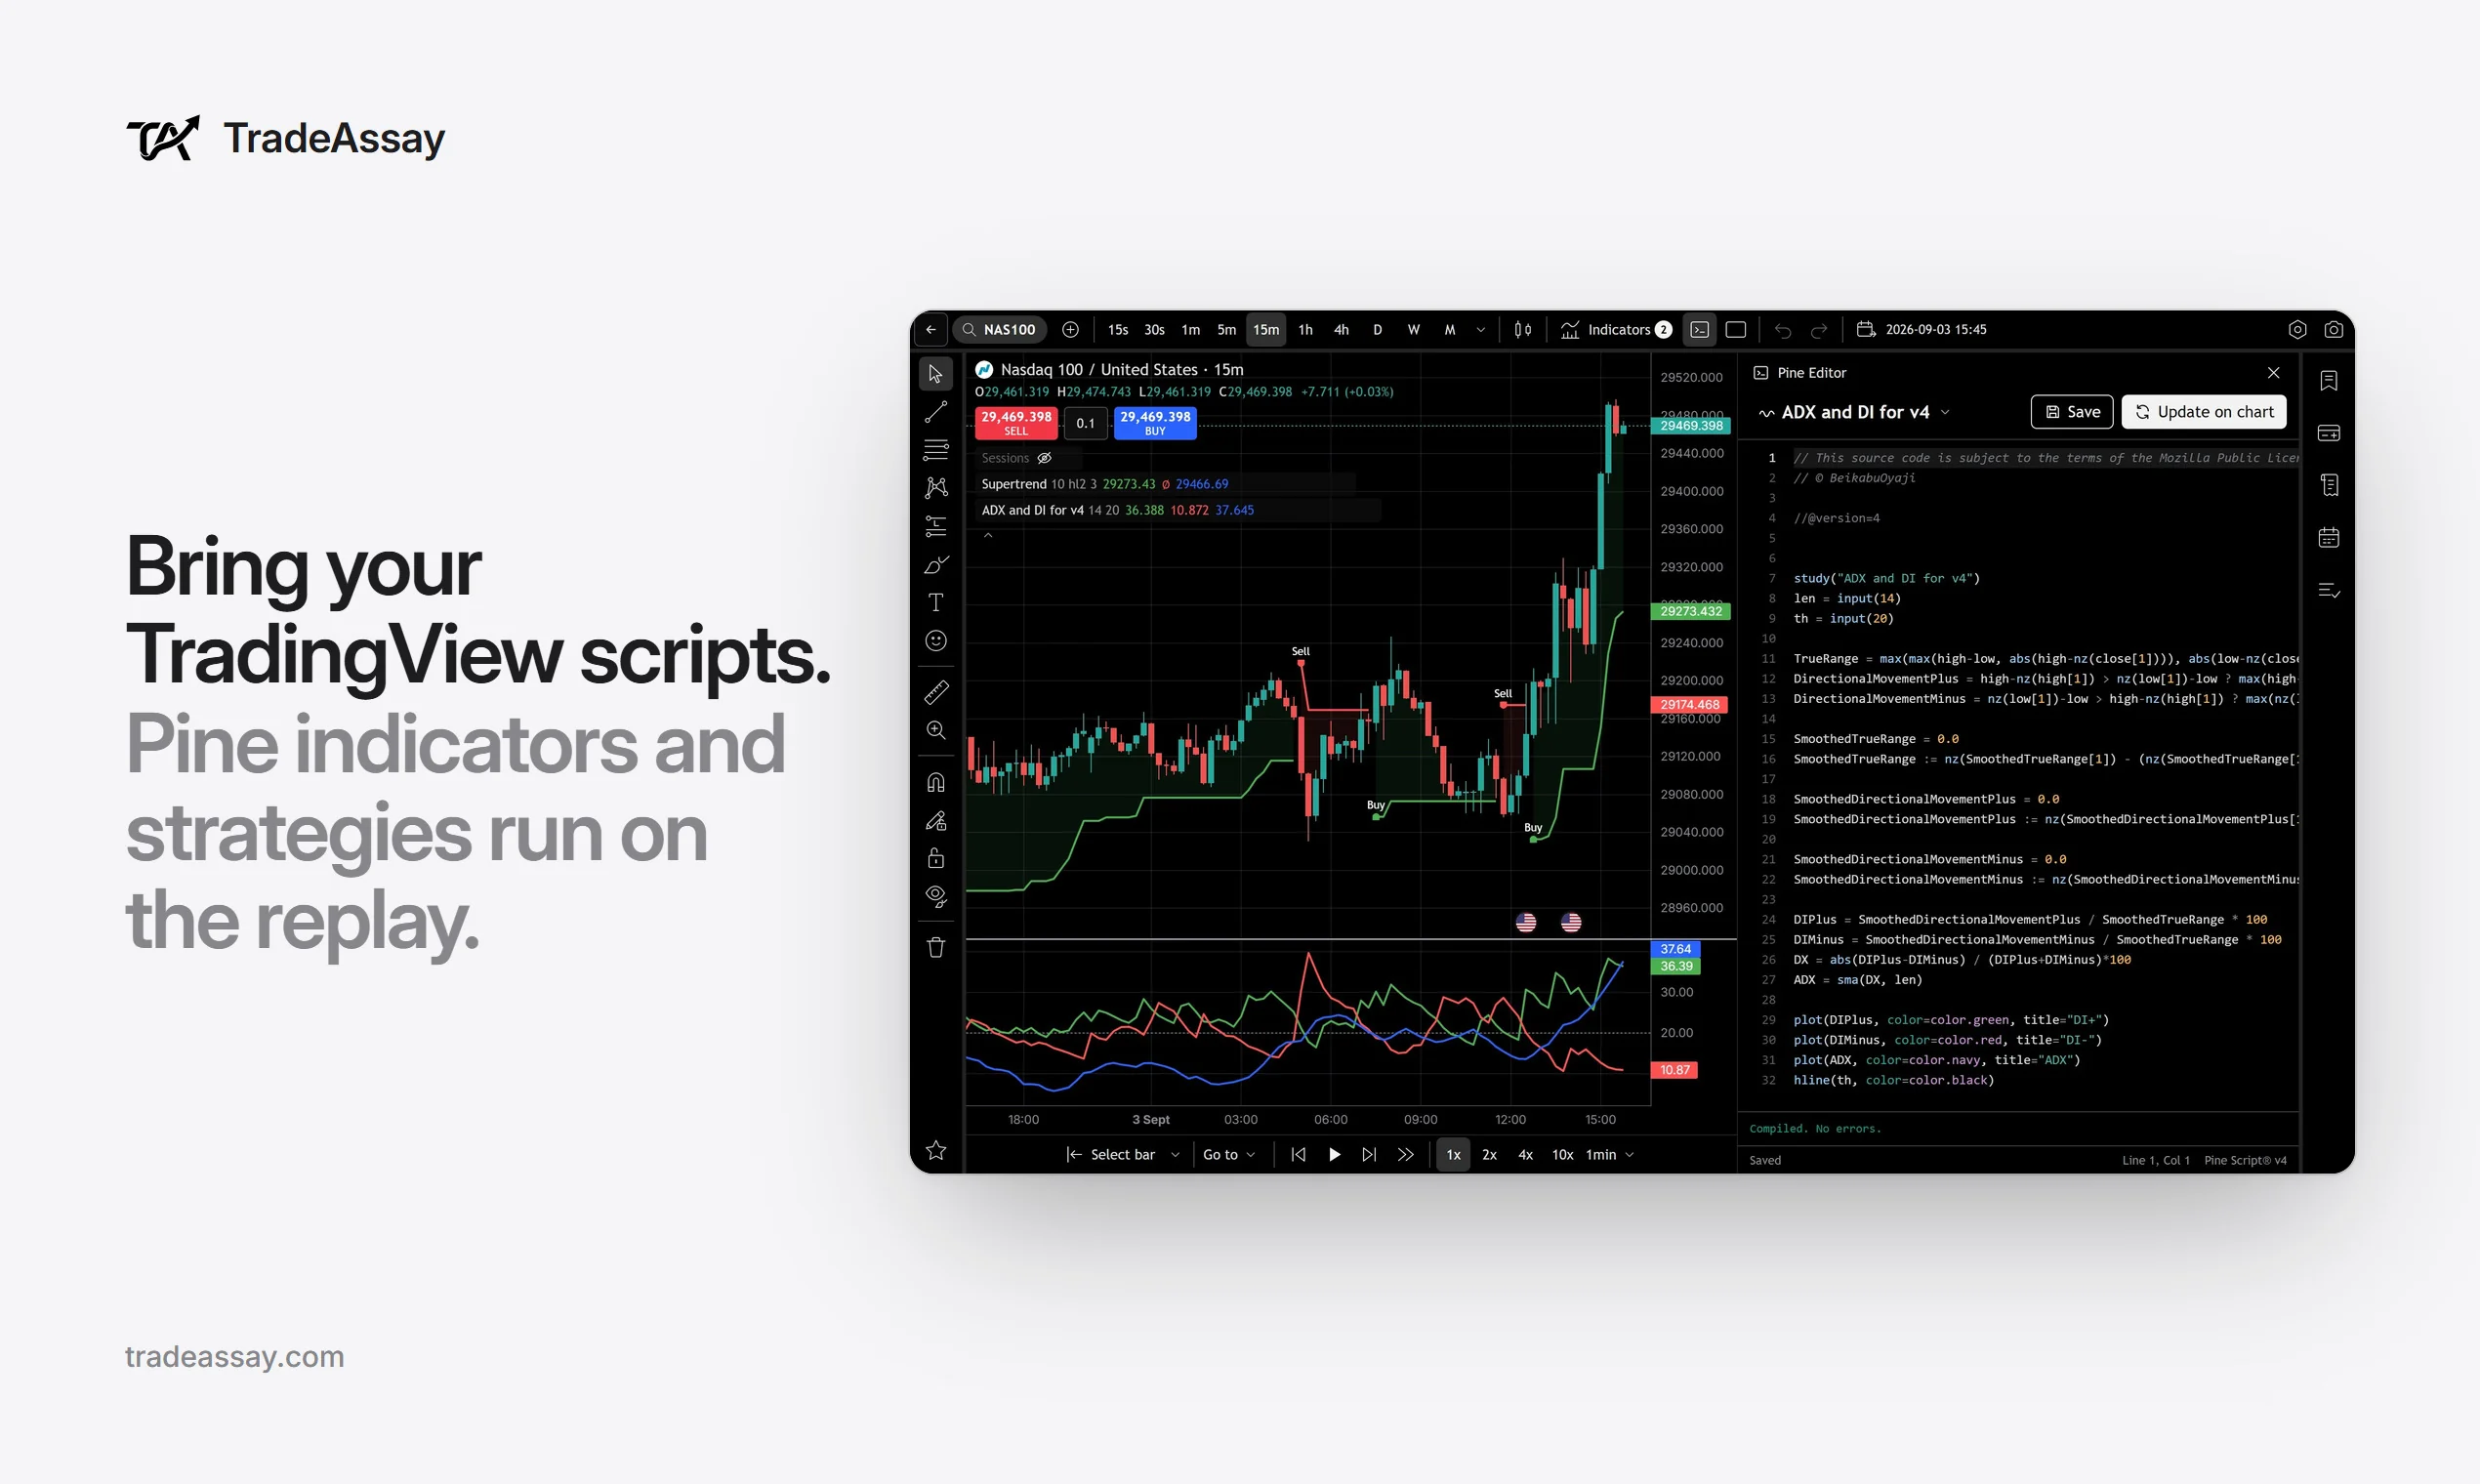
Paste the Pine Script® of an indicator or a strategy you use on TradingView (version 5 or 6), or pick one of
83 built-ins. It is worked out bar by bar as the replay moves, so it can't see bars that haven't happened
yet; a strategy() script places its orders on the replay and reports its trades. Your own scripts come
with Pro (5 on a chart) and Elite (no limit); the built-ins are on every plan.
What it doesn't do yet: the bar magnifier and strategy.risk rules are not simulated, and
matrices, enums and lower-timeframe requests are not supported; the editor names the line if a script uses one.
Pine Script® is a trademark of TradingView, Inc.; TradeAssay runs it with its own engine and is not affiliated with
TradingView.
5. Trade it bar by bar
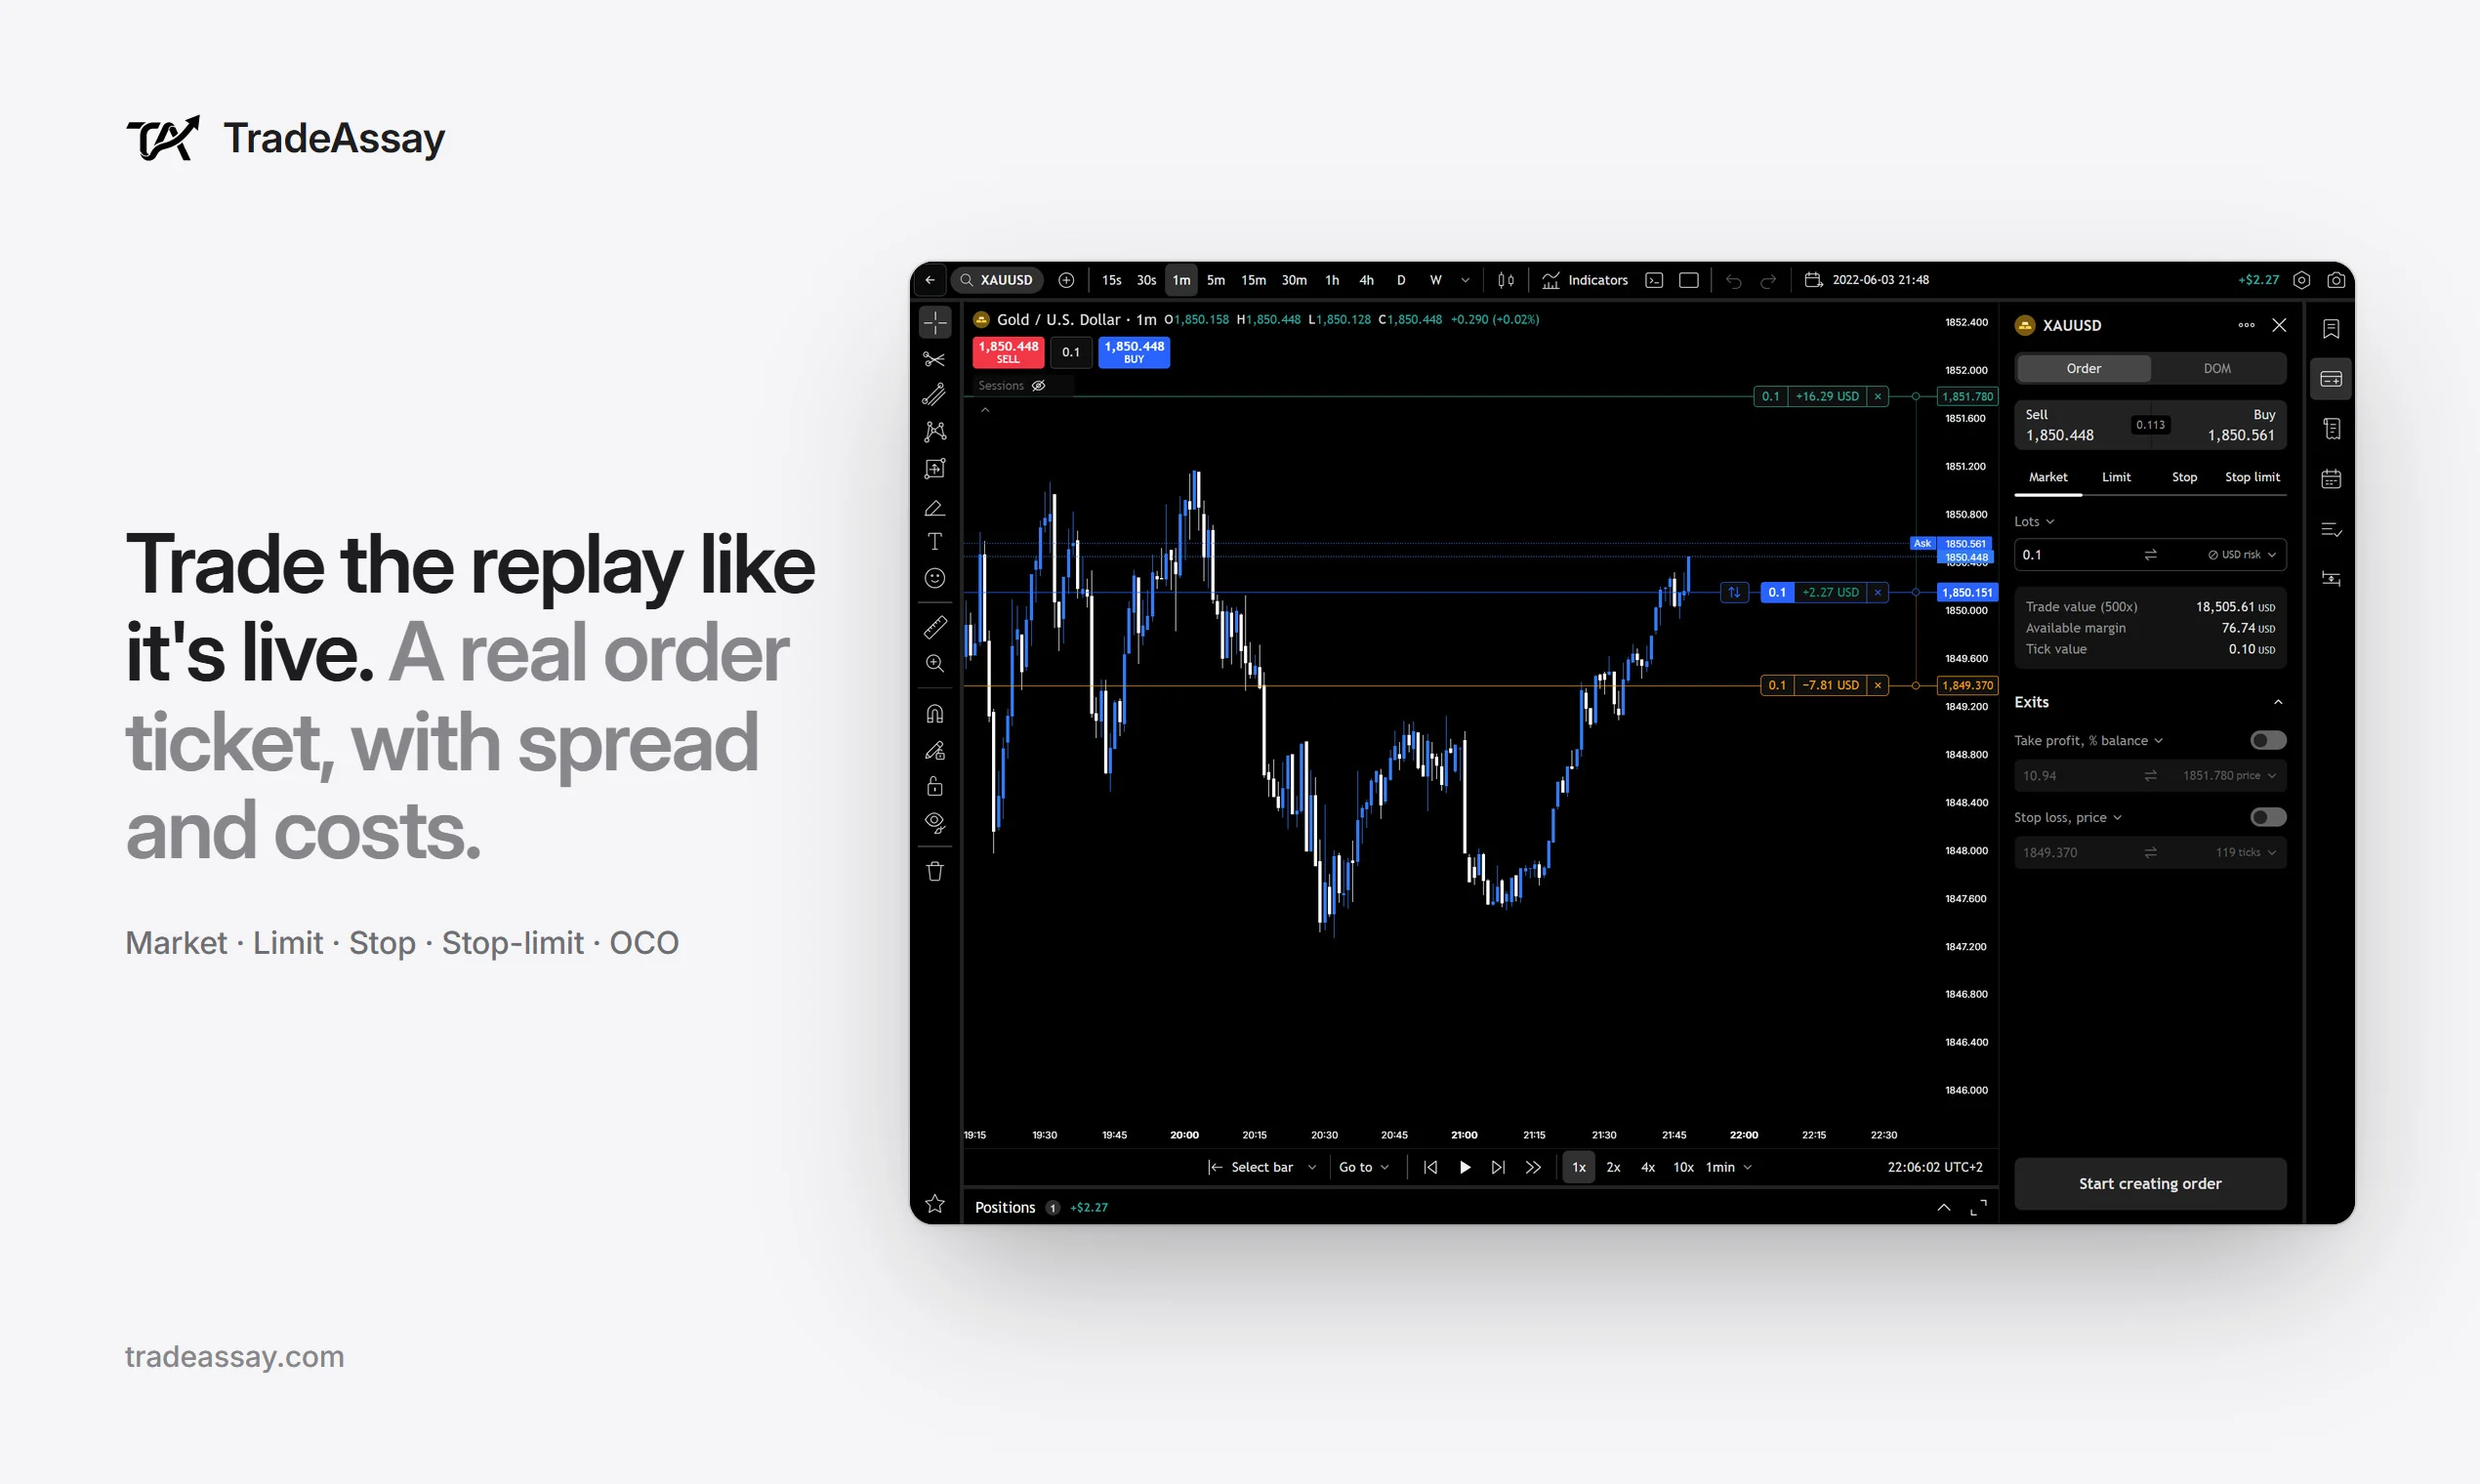
The order ticket works like a broker's: market, limit, stop and stop-limit orders, lots or risk in dollars, stop and target on the chart, with the bid and ask spread. Orders fill where price really reached them, and a bar that holds both your stop and your target takes the stop, so the result is never kinder than the market was.
6. Review the session
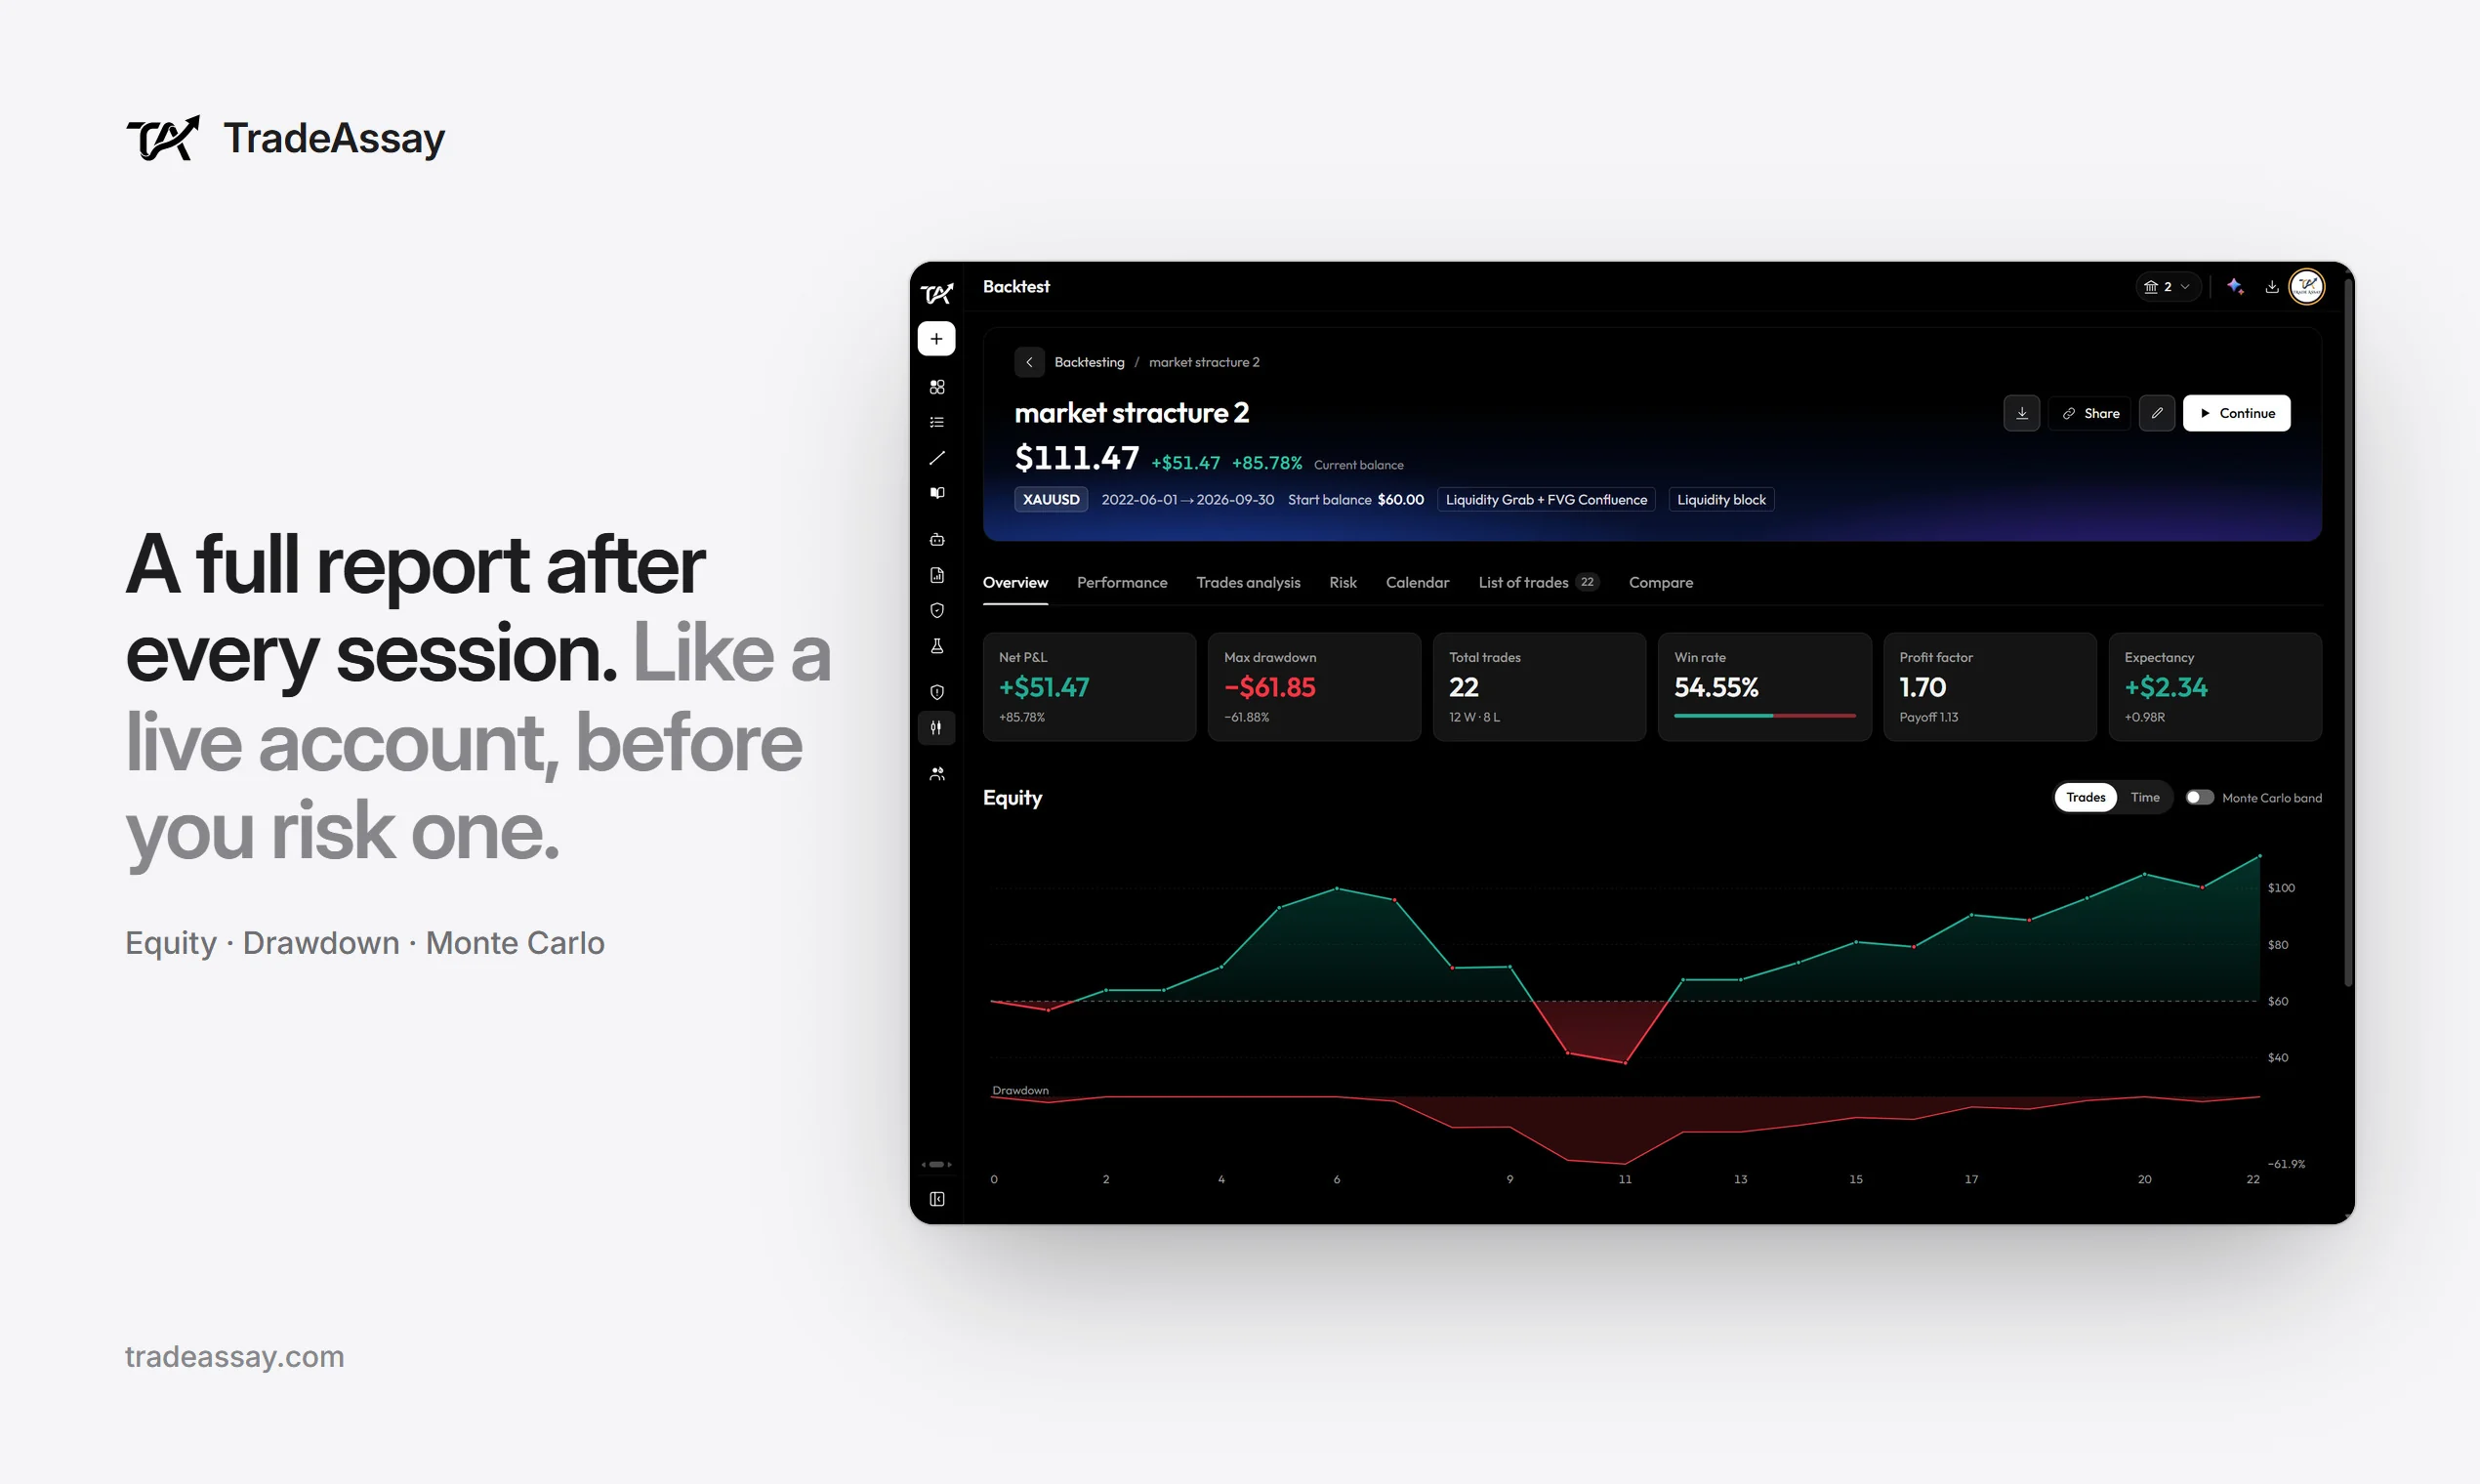
Every trade lands in the session's journal: win rate, profit factor, expectancy, drawdown, results in R and by setup, session and hour. To rehearse a prop-firm challenge, start a session with the firm's rules and the simulator checks the daily loss, the drawdown and the target on every candle.
Price: backtesting is on Pro ($9.99/mo or $79.99/yr) and Elite ($24.99/mo or $199.99/yr); the 7-day trial opens all of it with no card, and the free plan has no backtesting. More about the backtester.

How many trades should a backtest have?
More than feels necessary. A strategy with no edge at all shows a 60% win rate over twenty trades about one time in four, so a short backtest mostly measures luck. Proving a true 60% win rate takes about 100 trades; a true 55% takes roughly 370. Expectancy settles sooner than win rate. The full reasoning, with a calculator: how many trades before your statistics mean anything.
Frequently asked questions
Can you backtest on TradingView for free?
Partly. On the free Basic plan, Bar Replay works on daily, weekly and monthly charts, and you can run Pine Script strategies in the Strategy Tester on the bars the chart loads (5,000 on Basic). Replaying intraday charts needs a paid plan: 1-minute history starts on Essential (180 days) and Plus (365 days), and seconds on Premium.
Is TradingView Bar Replay free?
On daily and higher timeframes, yes: every plan, including the free Basic plan, can replay all of a symbol's daily history. Intraday replay is part of the paid plans, according to TradingView's pricing page on 21 November 2026.
Why is Bar Replay not working on lower timeframes?
Usually because of the plan: the free Basic plan has no intraday replay, Essential reaches 6 months back on 1-minute and Plus 1 year. If you switch to a lower timeframe that has no data at the replay point, TradingView shows Data point unavailable and keeps the timeframe. Renko, Kagi, Point and Figure, Range, Line Break, spread and tick-based charts cannot be replayed at all.
How far back does TradingView Bar Replay go?
Daily data goes back as far as the symbol has it, on every plan. On 1-minute charts Essential replays 6 months and Plus 1 year, longer on higher timeframes (Essential reaches 30 months on 5-minute and 90 months on 15-minute). Premium and above replay all of a symbol's intraday history, seconds from August 2022, and Ultimate adds 7 days of ticks.
How many bars does the TradingView Strategy Tester use?
The bars loaded on the chart: 5,000 on Basic, 10,000 on Essential and Plus, 20,000 on Premium and 40,000 on Ultimate, according to TradingView's pricing page. On a 24-hour market, 5,000 one-minute bars are about three and a half days.
What is the best alternative to TradingView Bar Replay?
For forex, gold, indices, futures and crypto, TradeAssay replays 762 symbols bar by bar from 1 second to 12 months, runs your TradingView Pine Script indicators and strategies on the replay, and keeps every backtest trade in a journal with its statistics, from $9.99 a month. FX Replay is a dedicated replay tool from $17.99 a month, and Forex Tester Online is a browser backtester with years of tick data.
Can I use my TradingView indicators in another backtester?
In TradeAssay, yes: paste the Pine Script of an indicator or a strategy (version 5 or 6) and it runs bar by bar on the replay; a strategy places its orders and reports its trades. A few newer features are not supported yet (matrices, enums and lower-timeframe requests), and the bar magnifier is not simulated. Pine Script is a trademark of TradingView; TradeAssay is not affiliated with TradingView.
How do I backtest forex or gold on 1-minute charts for years?
On TradingView you need Premium or higher for all of a symbol's 1-minute history in Bar Replay. In TradeAssay, Pro ($9.99 a month) replays forex and gold in 1-minute bars back to 2003, with real spreads and an order ticket, and every trade goes into the session's journal.
How many trades should a backtest have?
Enough that luck stops deciding the result: a strategy with no edge at all shows a 60% win rate over twenty trades about one time in four. Proving a true 60% win rate takes about 100 trades, and a true 55% roughly 370. Expectancy settles sooner than win rate.

Written by the TradeAssay Team, traders with more than seven years of experience in forex, gold, indices and futures. TradingView's plans, prices and limits were read on TradingView's own pages on 21 November 2026. If something here is out of date, write to support@tradeassay.com and we'll correct it.
Replay 762 symbols bar by bar, with your TradingView indicators on the chart and every trade in a journal.
Start freeTrading foreign exchange, futures and other leveraged products carries a high level of risk and is not suitable for every investor. TradingView and Pine Script are trademarks of TradingView, Inc.; product names are the trademarks of their owners and are used only to compare. This page is not investment advice.