


Free trading journal template for Excel, Google Sheets and PDF
A ready-made journal for forex, gold, index, futures and crypto traders. You type a trade's prices; the sheet works out the dollars, the R and every number you need for your weekly review. Below it: the columns that matter, the formulas behind them, and a printable version.
Would rather not type every trade? TradeAssay can fill the journal in for you from MetaTrader, cTrader and crypto exchanges.

In 30 seconds
- What you getA journal, a dashboard of 24 numbers, a monthly report, a daily plan and a printable PDF.
- What you typeDate, symbol, buy or sell, size, entry, stop, target, exit, costs, setup and whether you kept your plan.
- What it works outP&L in dollars, risk, R, win rate, profit factor, expectancy, drawdown and streaks.
Excel, Google Sheets, Notion, paper or an app?
A trading journal template comes in five forms. They all hold the same record; they differ in how much of the work they do for you.
| Format | Best for | Good at | Watch out for |
|---|---|---|---|
| Excel | Most traders | Real formulas and charts, works offline, private | You type every trade |
| Google Sheets | Logging from phone and computer | Free, syncs everywhere, easy to share with a mentor | The same typing; slower with thousands of rows |
| Notion | Notes and screenshots | Rich pages, pictures, tags | Weak at maths: P&L, R and drawdown need workarounds |
| Printable PDF | Writing by hand | Nothing to set up, no screen time | No calculations at all |
| A journal app | Active traders | Trades imported or synced, every trade on its chart, deep analysis | A new tool to learn; the advanced parts are paid |
This template covers the first, second and fourth: one Excel file that also opens in Google Sheets, and a printable PDF. When you outgrow it, the same file moves into TradeAssay with every trade in it.
What is inside the template
Every sheet does one job. You only ever type in two of them: Journal after each trade, and Daily plan before the market opens if you use it.
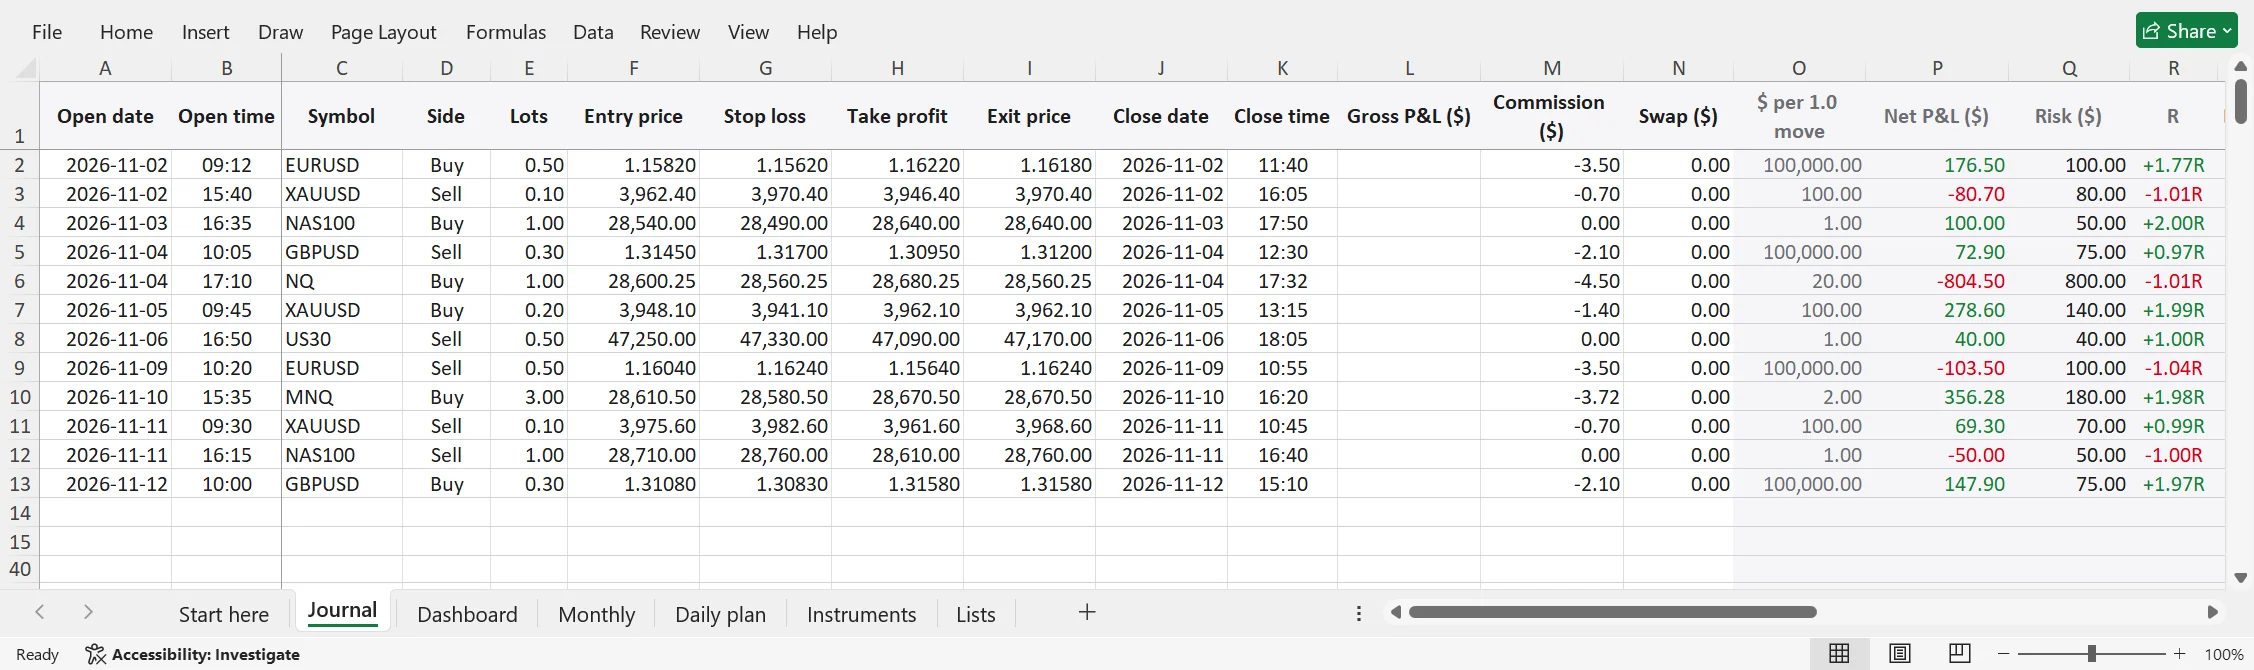
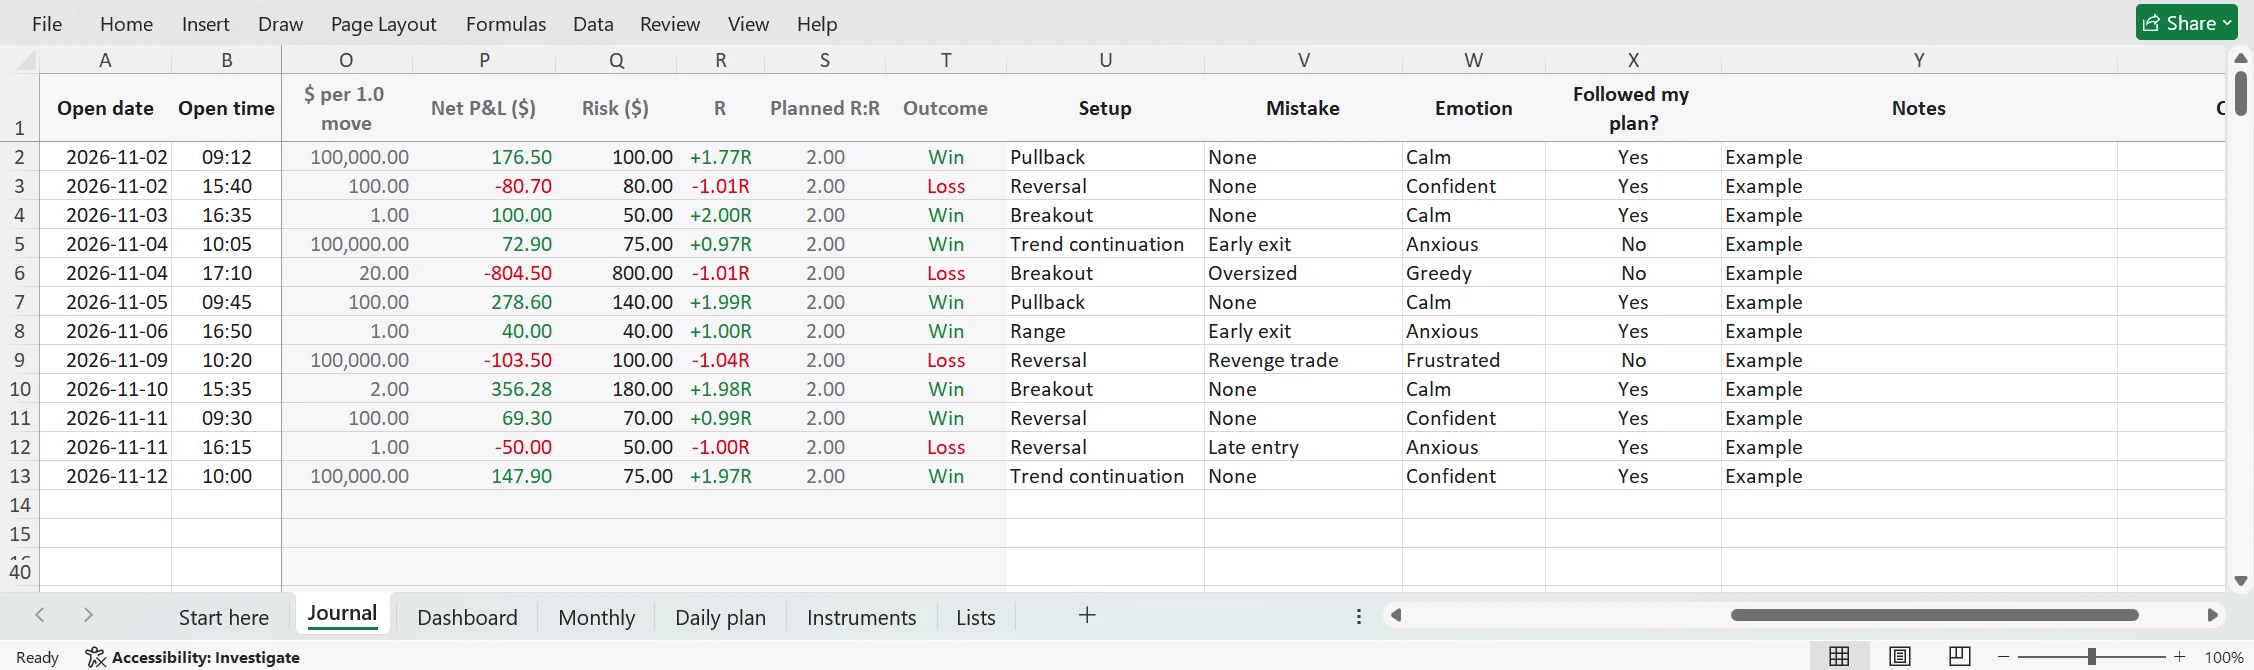
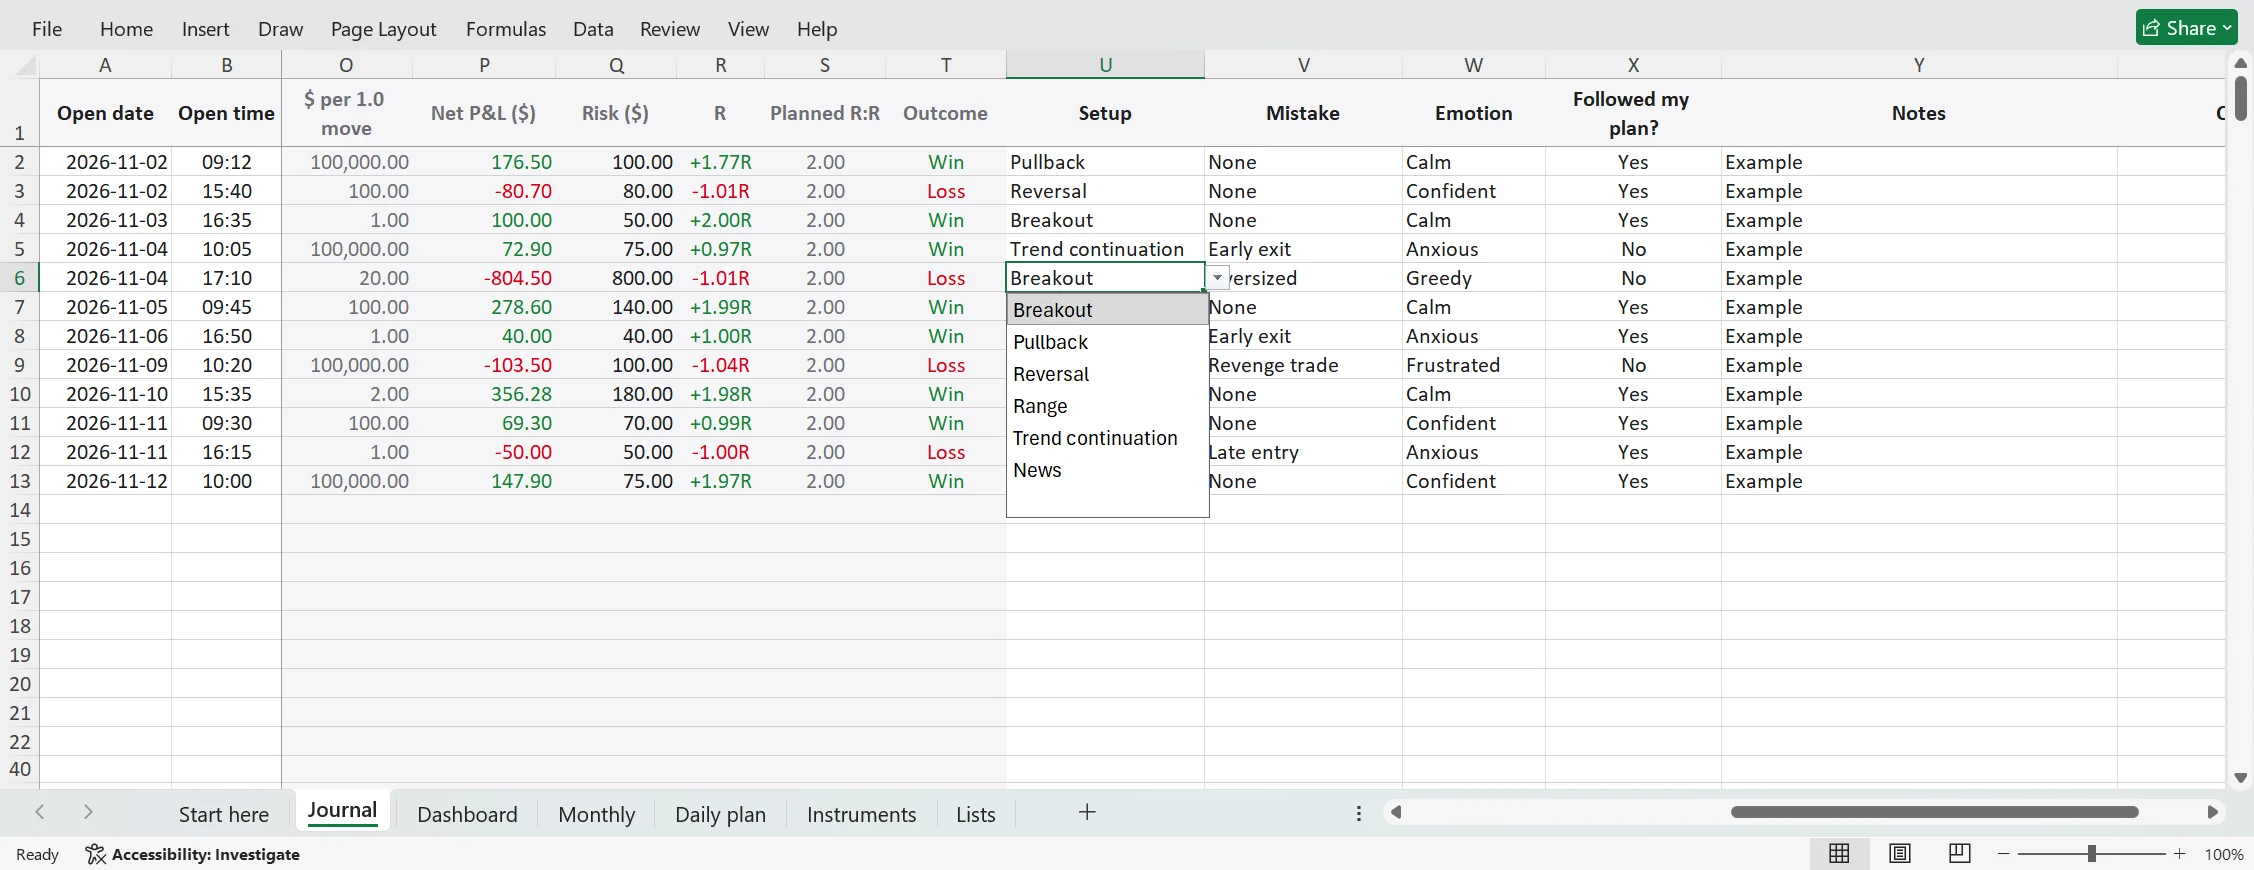
- Journal. One row per trade, 1,000 rows ready. White columns are yours; grey columns calculate themselves.
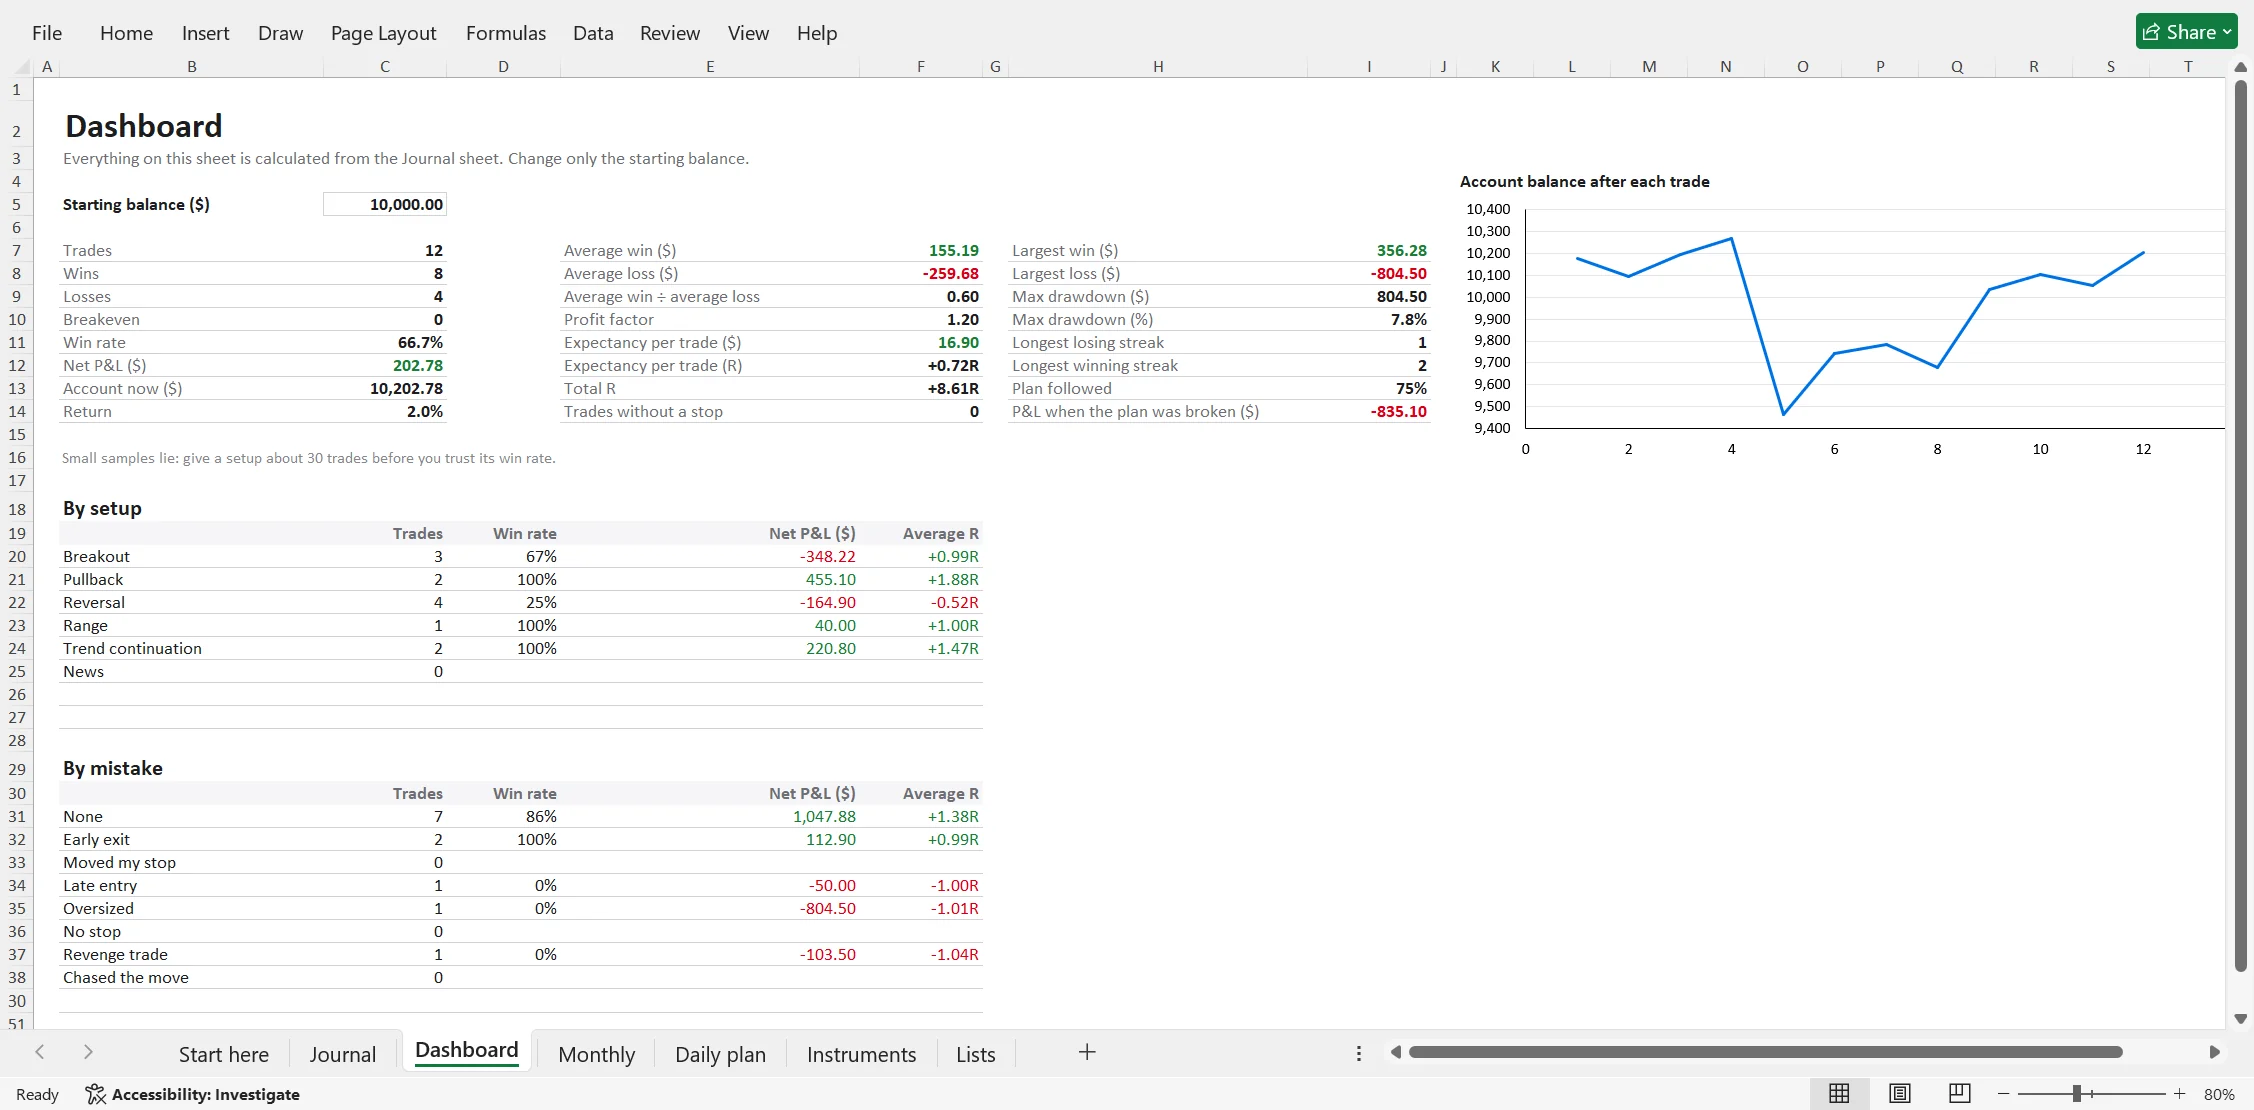
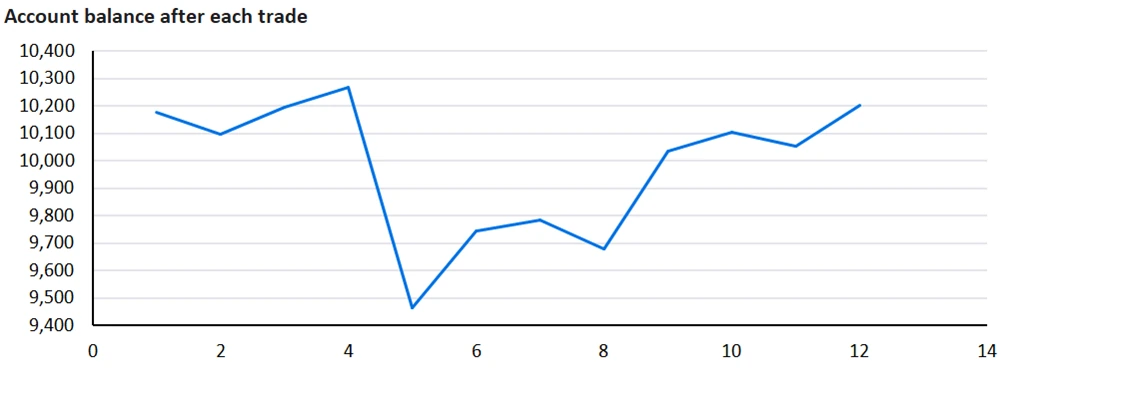
- Dashboard. 24 numbers about your trading, a balance curve, and tables by setup, mistake, emotion, weekday and whether you followed your plan.
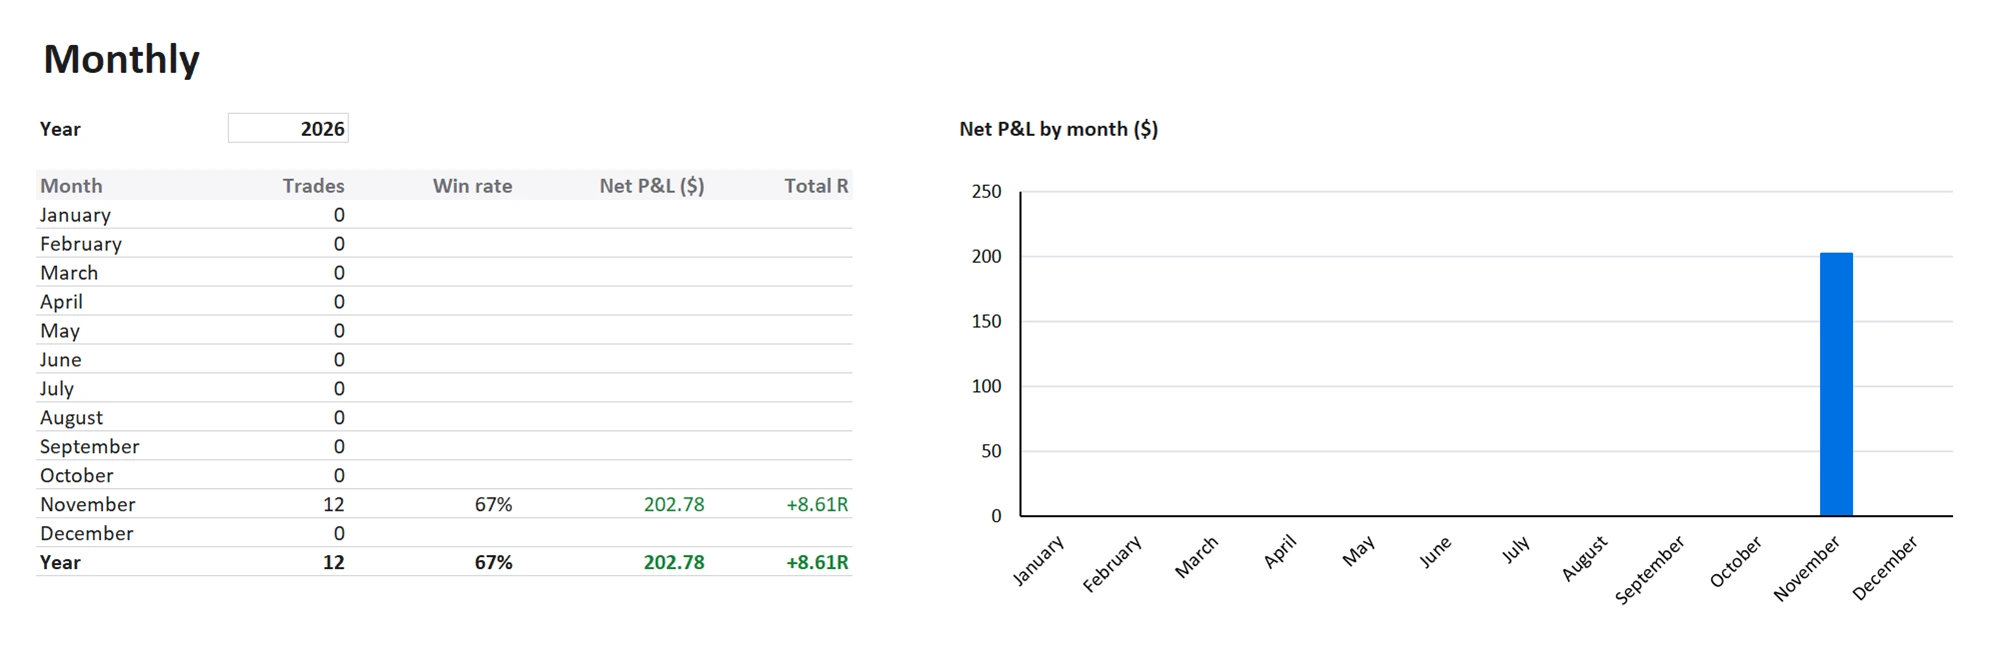
- Monthly. Trades, win rate, net P&L and total R for each month of the year you choose, with a chart.
- Daily plan. Your bias, key levels, the day's news, the most you allow yourself to lose today, and a short review after the close.
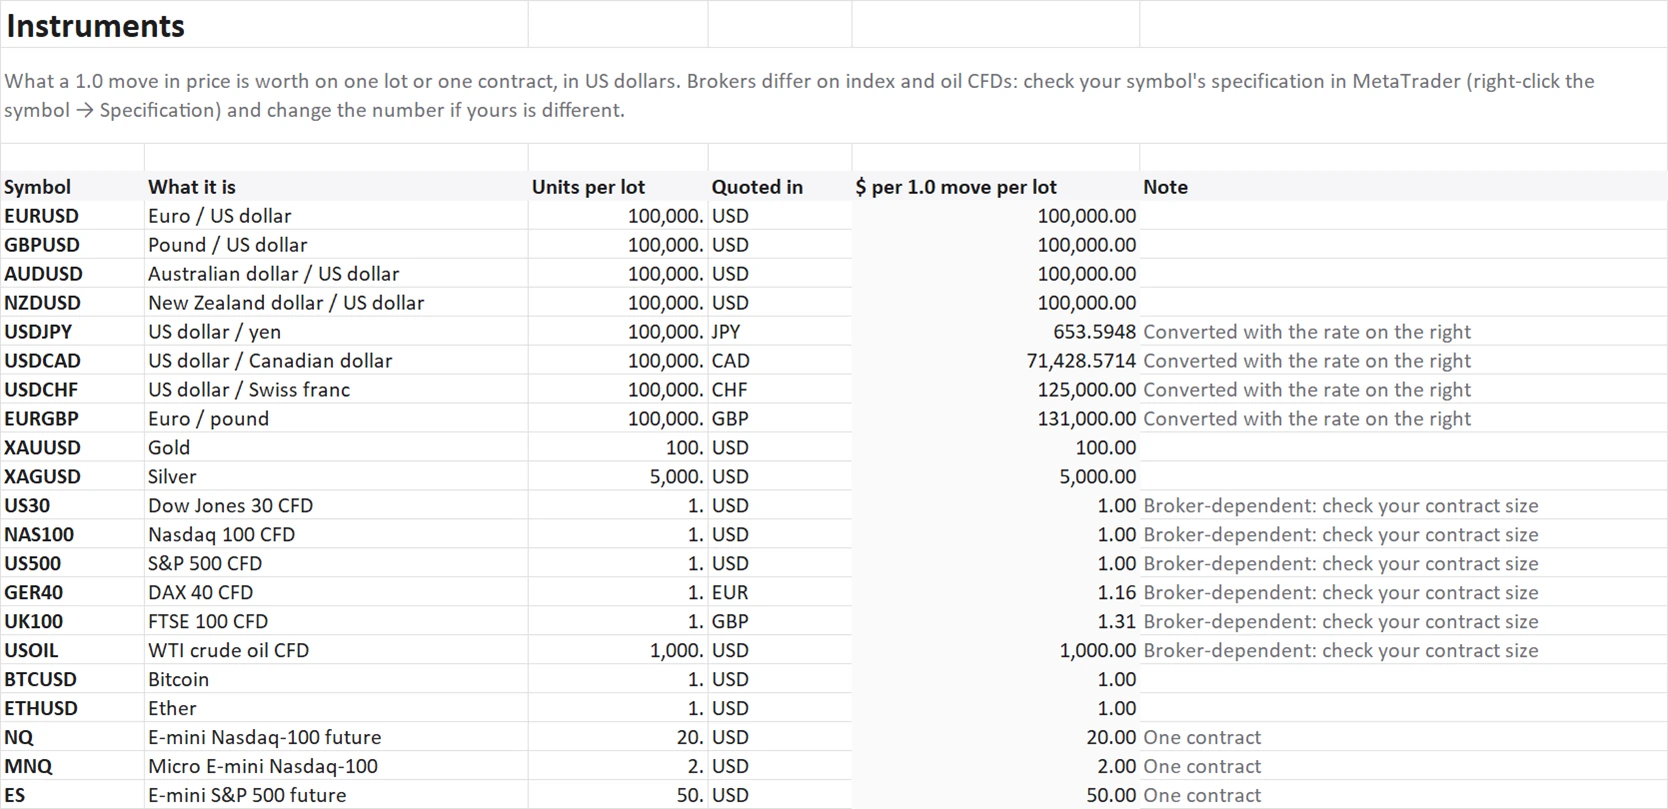
- Instruments. What a 1.0 move is worth on one lot for the common forex pairs, metals, index CFDs, oil, crypto and US futures.
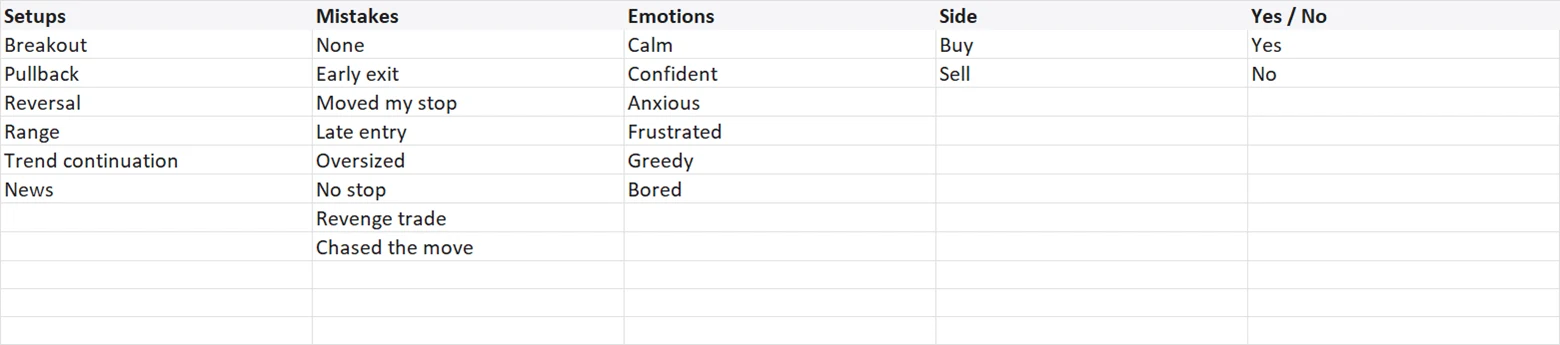
- Lists. Your setups, mistakes and emotions for the dropdowns. Rename them to your own words.
- Start here. One page: how to use it, and four numbers worth knowing.
The columns every trading journal needs
A journal you stop filling in is worth nothing, so fewer columns you actually keep beat forty you abandon. These are the ones that pay for the typing:
| Column | What to write | Why it matters |
|---|---|---|
| Date and time | When you opened and closed | Finds your best and worst hours and weekdays |
| Symbol and side | EURUSD, XAUUSD, NQ…; buy or sell | Shows which markets and which direction pay you |
| Size | Lots or contracts | Catches oversized trades, often the most expensive mistake |
| Entry and exit | The prices you actually got | Your P&L, worked out, not guessed |
| Stop loss | The stop you entered with | Defines your risk, and so your R |
| Take profit | Your planned target | Planned reward to risk, and whether you cut winners short |
| Commission and swap | From your broker's statement | Costs quietly eat a small edge |
| Setup | Which of your setups it was | Which setup actually makes money |
| Mistake | None, early exit, moved stop… | What each mistake costs you, in dollars |
| Emotion | Calm, anxious, greedy… | Links your state of mind to your results |
| Followed my plan? | Yes or no | The single most useful column in the journal |
| Notes and chart link | One line, and a link to a screenshot | The context you need when you review |
The template has exactly these, with dropdowns for side, setup, mistake, emotion and plan so a row takes under a minute.
How to fill it in, step by step
- Open the file and read Start here once. It is one page.
- In Journal, delete the example rows: select the row numbers 2 to 13, right-click and choose Delete. (The Delete key alone would also erase the grey formulas.)
- After each trade, fill one row: date and time, symbol, side, lots, entry, the stop you entered with, target, exit, commission and swap.
- Pick the setup, any mistake, how you felt and whether you followed your plan from the dropdowns. These four columns are what make the review useful later.
- On the Dashboard, type your starting balance once. Everything else there updates by itself.
Here is the first example trade, so you can see what the sheet does with your numbers. You bought 0.50 lot of EURUSD at 1.15820 with a stop at 1.15620 and a target at 1.16220, closed at 1.16180 and paid $3.50 in commission.
The stop matters more than any other column. R measures each result against what you were prepared to lose, so it must be the stop you had when you entered. If you moved it later, still write the first one. Moving it is a mistake worth recording, and it quietly breaks your R if you don't.
The formulas, if you want to build your own
Nothing in the template is hidden or locked. These are its formulas for the first trade row, simplified for reading (the file also leaves a row blank until it has the prices it needs). The columns are the template's: D side, E lots, F entry, G stop, H target, I exit, M commission, N swap, O the dollar value of a 1.0 move, P net P&L, Q risk, R the result in R and T the outcome.
| Figure | What it means | Excel formula |
|---|---|---|
| Net P&L | Price move × size × value of a move, less costs | =(I2-F2)*IF(D2="Sell",-1,1)*O2*E2-ABS(M2)+N2 |
| Risk | What you stood to lose at your stop | =ABS(F2-G2)*O2*E2 |
| R | The result measured in the risk you took | =P2/Q2 |
| Planned R:R | Distance to target ÷ distance to stop | =ABS(H2-F2)/ABS(F2-G2) |
| Win rate | Wins ÷ (wins + losses) | =COUNTIF(T:T,"Win")/(COUNTIF(T:T,"Win")+COUNTIF(T:T,"Loss")) |
| Profit factor | Everything won ÷ everything lost | =SUMIF(P:P,">0")/ABS(SUMIF(P:P,"<0")) |
| Expectancy | The average trade, in R or in dollars | =AVERAGE(R:R) · =AVERAGE(P:P) |
| Max drawdown | The deepest fall from a high point | Balance in AA =Start+SUM($P$2:P2), its running high in AB =MAX($AA$2:AA2), the fall in AC =AB2-AA2, then =MAX(AC:AC) (hidden columns in the file) |
The value of a 1.0 move in column O is looked up from the Instruments sheet by the symbol, which is what lets one formula work for EURUSD, gold and Nasdaq futures alike.
Where the dollars come from
The sheet multiplies the price move by the size and by what a 1.0 move is worth on one lot. That last number lives in the Instruments sheet and follows the standard contracts: a forex lot is 100,000 units, so one pip (0.0001) is $10 per lot on EURUSD; a lot of gold is 100 ounces, so a $1 move is $100; index CFDs are usually $1 per point per lot; futures use the exchange's multiplier.
| Symbol | A 1.0 move on one lot or contract | Note |
|---|---|---|
| EURUSD, GBPUSD, AUDUSD | $100,000 | One pip is $10 |
| USDJPY, USDCAD, USDCHF | 100,000 ÷ the rate | Rates are on the same sheet; update them now and then |
| XAUUSD (gold) | $100 | A $0.01 move is $1 |
| US30, NAS100, US500 | $1 | Brokers differ: check your contract size |
| NQ · MNQ | $20 · $2 | One contract |
| ES · MES | $50 · $5 | One contract |
| GC · CL | $100 · $1,000 | One contract |
Broker names work too: XAUUSDm, EURUSD.pro and US30.cash all find their row. For futures, type the root (NQ, not NQZ6). If your broker shows a different figure for a trade, type it in Gross P&L and the sheet uses it instead of its own maths. In MetaTrader you find the real contract by right-clicking a symbol and choosing Specification.
A trading journal template for your market
One file covers them all, but each market has its own catch:
- Forex. Lots of 100,000 units. Pairs not quoted in dollars, such as USDJPY, are converted with the rate on the Instruments sheet. On swing trades, record the swap: it adds up. Size a trade first with the forex position size calculator.
- Gold (XAUUSD). 100 ounces per lot, so a $1 move is $100 a lot, and gold moves about $30 in an hour at its busiest. Note the hour of each trade: when gold really moves matters for your stops.
- Index CFDs. US30, NAS100, US500, GER40 and UK100 are usually $1 per point per lot, but brokers differ. Check the contract once and correct the Instruments row.
- Futures. NQ, MNQ, ES, MES, YM, MYM, RTY, M2K, GC, MGC, CL and MCL at their exchange multipliers. Record commission for the round trip; on micros it is a real share of a scalp.
- Crypto. BTCUSD and ETHUSD at one coin per lot. On exchange futures, put funding in the Swap column. The crypto futures calculator works out size and liquidation.
- Prop firm challenges. The Dashboard shows your maximum drawdown, and the Daily plan holds your loss limit for the day. The sheet does not know your firm's trailing drawdown or daily-loss rule; read why traders fail prop firm challenges for the arithmetic.
The printable trading journal (PDF)
Some traders keep their journal on paper on purpose: writing a trade by hand makes you look at it. The PDF has two A4 landscape pages: a trade log with the same columns as the spreadsheet, and a weekly review with eight boxes for your numbers and five questions.
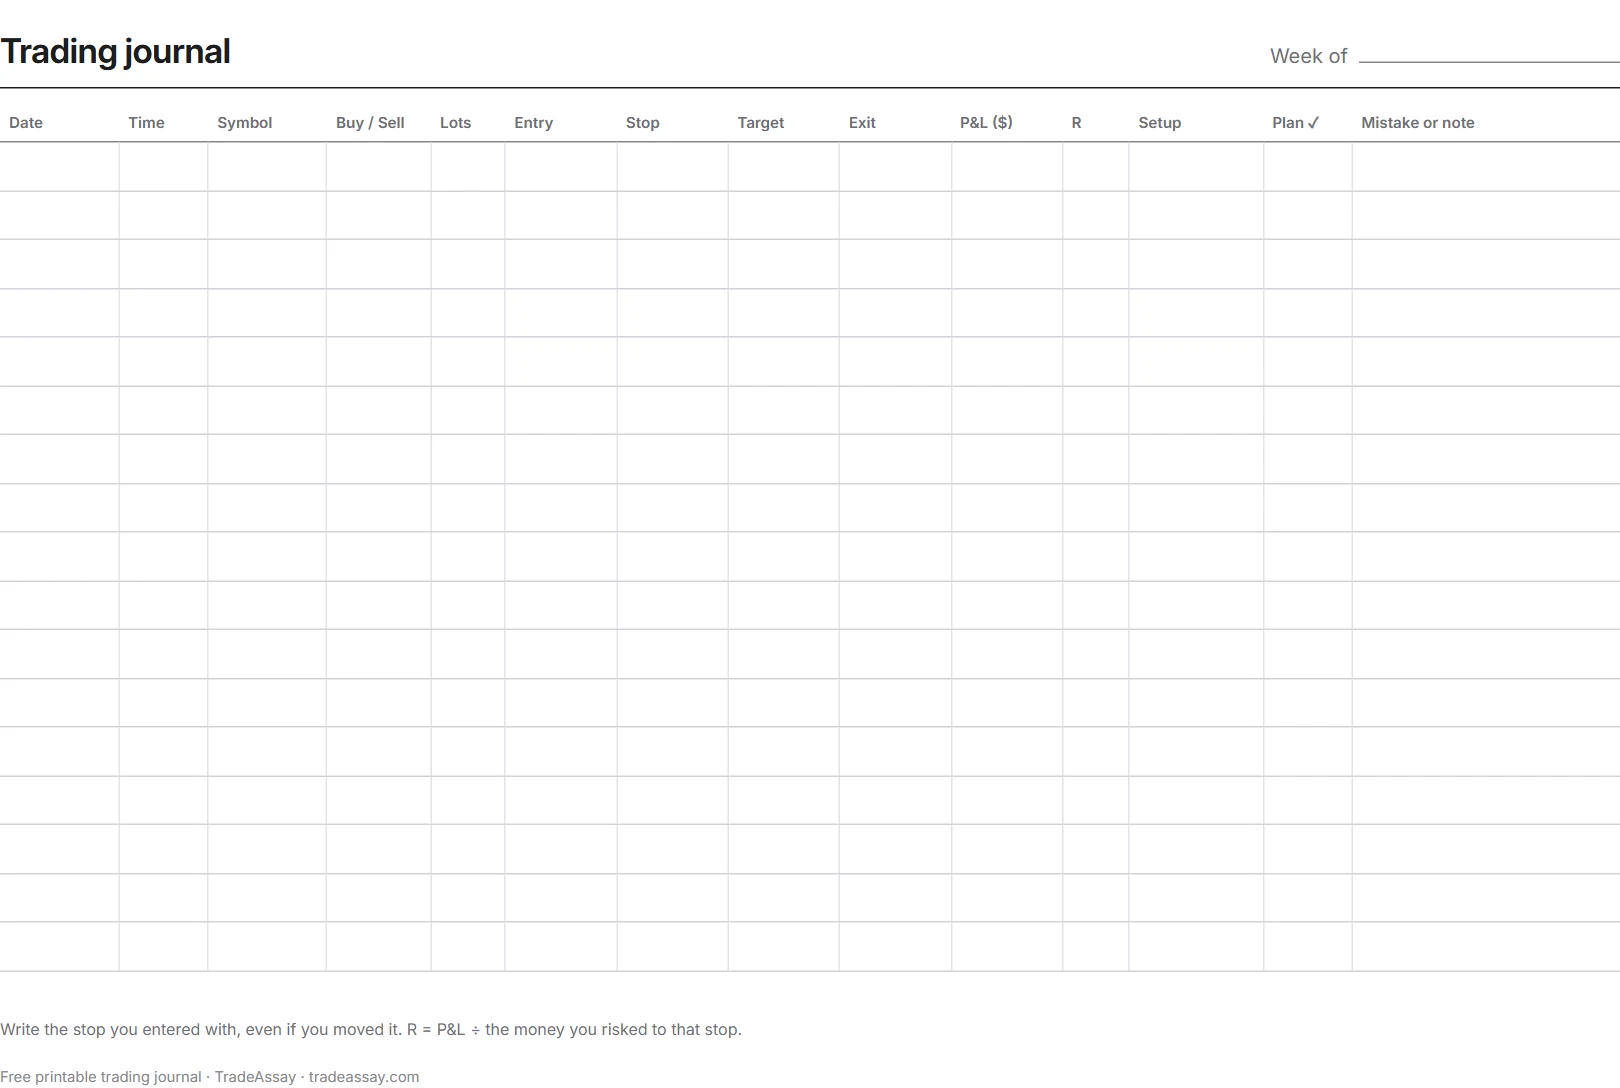
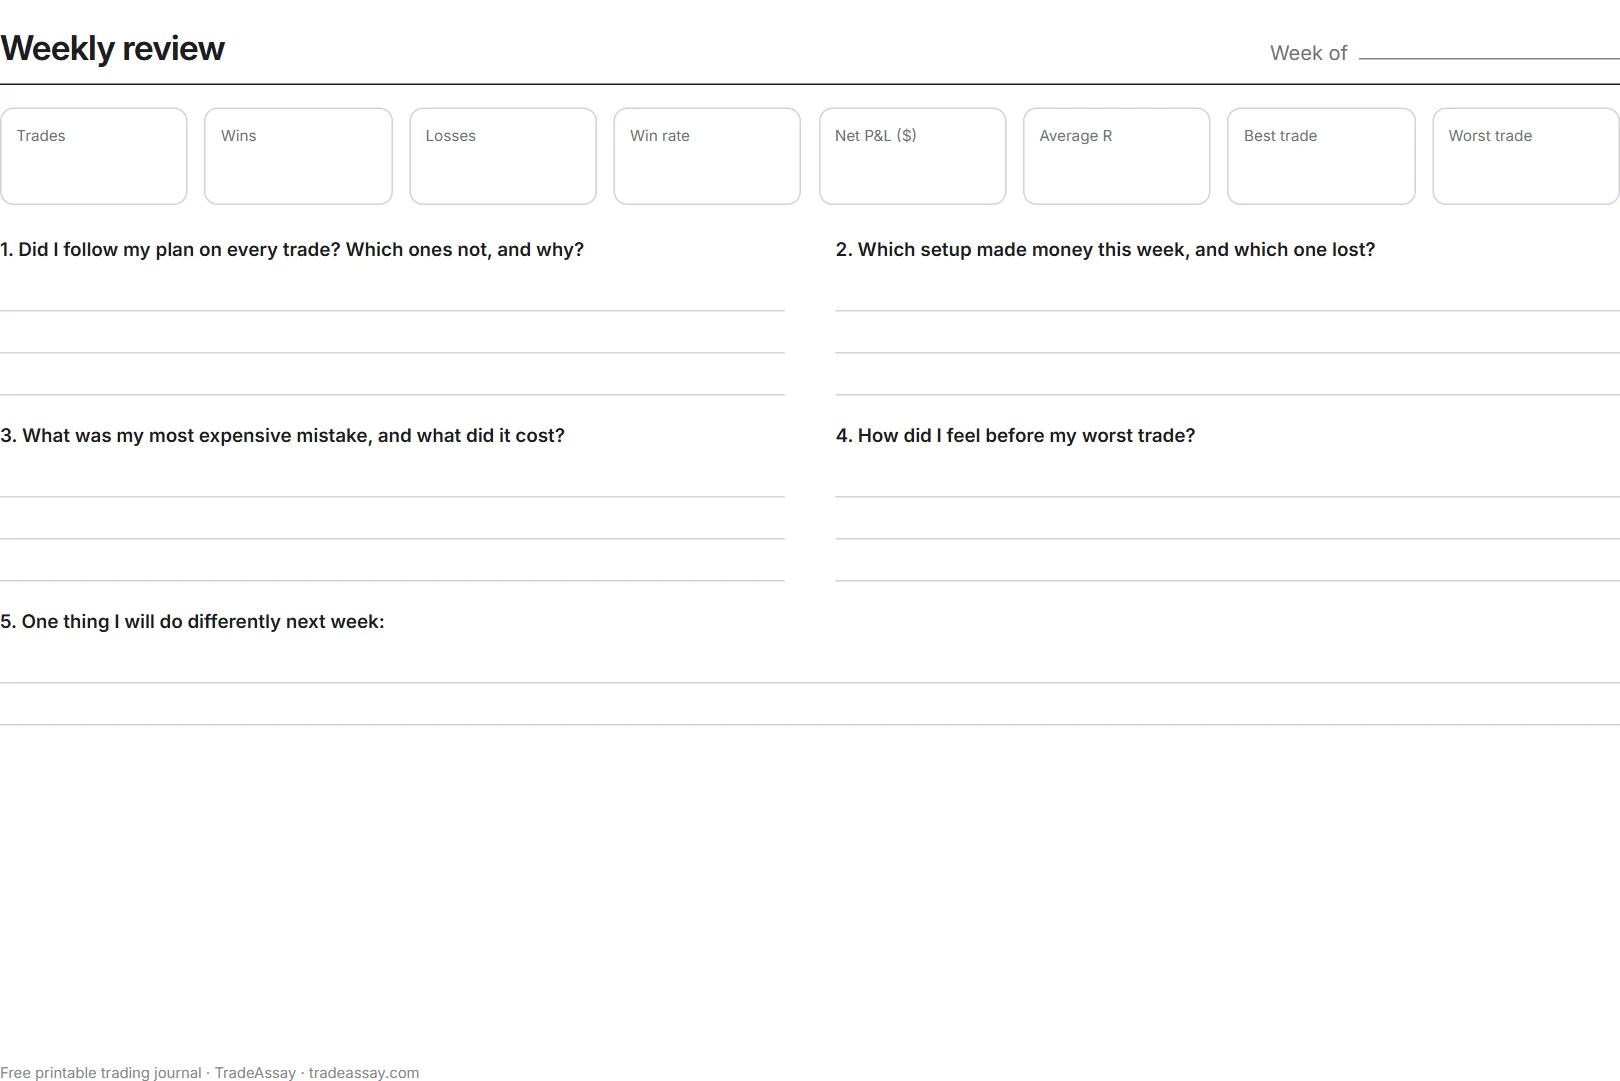
Download the printable PDF and print as many copies as you need.
A daily plan, before the market opens
The Daily plan sheet is the other half of a journal: what you meant to do, written before you knew how the day would go. One row a day: your bias, key levels, the day's news, the most you will lose today, how you feel from 1 to 10, and after the close, a short review and one thing for tomorrow.

How to review your journal once a week
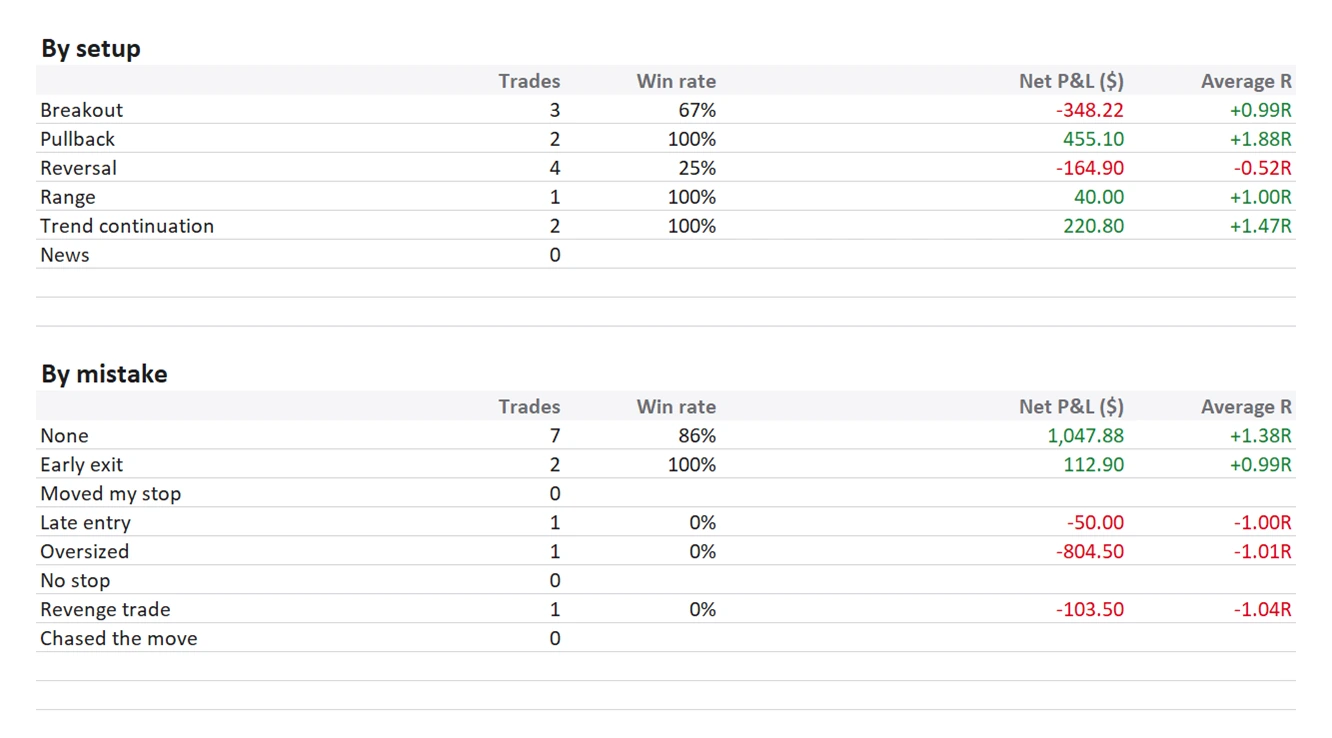
A journal earns its keep in the weekly review, not in the typing. The twelve example trades show why the Dashboard looks past the win rate.
- The win rate looked great and the money didn't. Eight wins out of twelve is 66.7%, yet the profit factor is only 1.20, because the average loss ($259.68) is bigger than the average win ($155.19).
- One trade did that. A single NQ contract risked $800 while every other trade risked $40 to $180. It lost $804.50, and the Mistake column says why: oversized.
- R tells the truth about the setup. Breakout lost $348.22 in dollars, but its average result is +0.99R. The setup worked; the size of one trade did not.
- Following the plan was the whole edge. The three trades marked "No" lost $835.10 together. The nine trades that followed the plan made $1,037.88.
Five questions to answer every week, the same ones printed on page 2 of the PDF:
- Did I follow my plan on every trade? Which ones not, and why?
- Which setup made money this week, and which one lost?
- What was my most expensive mistake, and what did it cost?
- How did I feel before my worst trade?
- One thing I will do differently next week.
One warning the sheet prints for you: small samples lie. Give a setup about 30 trades before you trust its win rate, and read how many trades your statistics need before you change a method because of a bad week.
Using it in Google Sheets
The quickest way: make your own copy in Google Sheets. It lands in your Google Drive, private to you. Or do it by hand:
- Download the Excel file above.
- In Google Drive, choose New → File upload and pick the file.
- Right-click it, choose Open with → Google Sheets, then File → Save as Google Sheets.
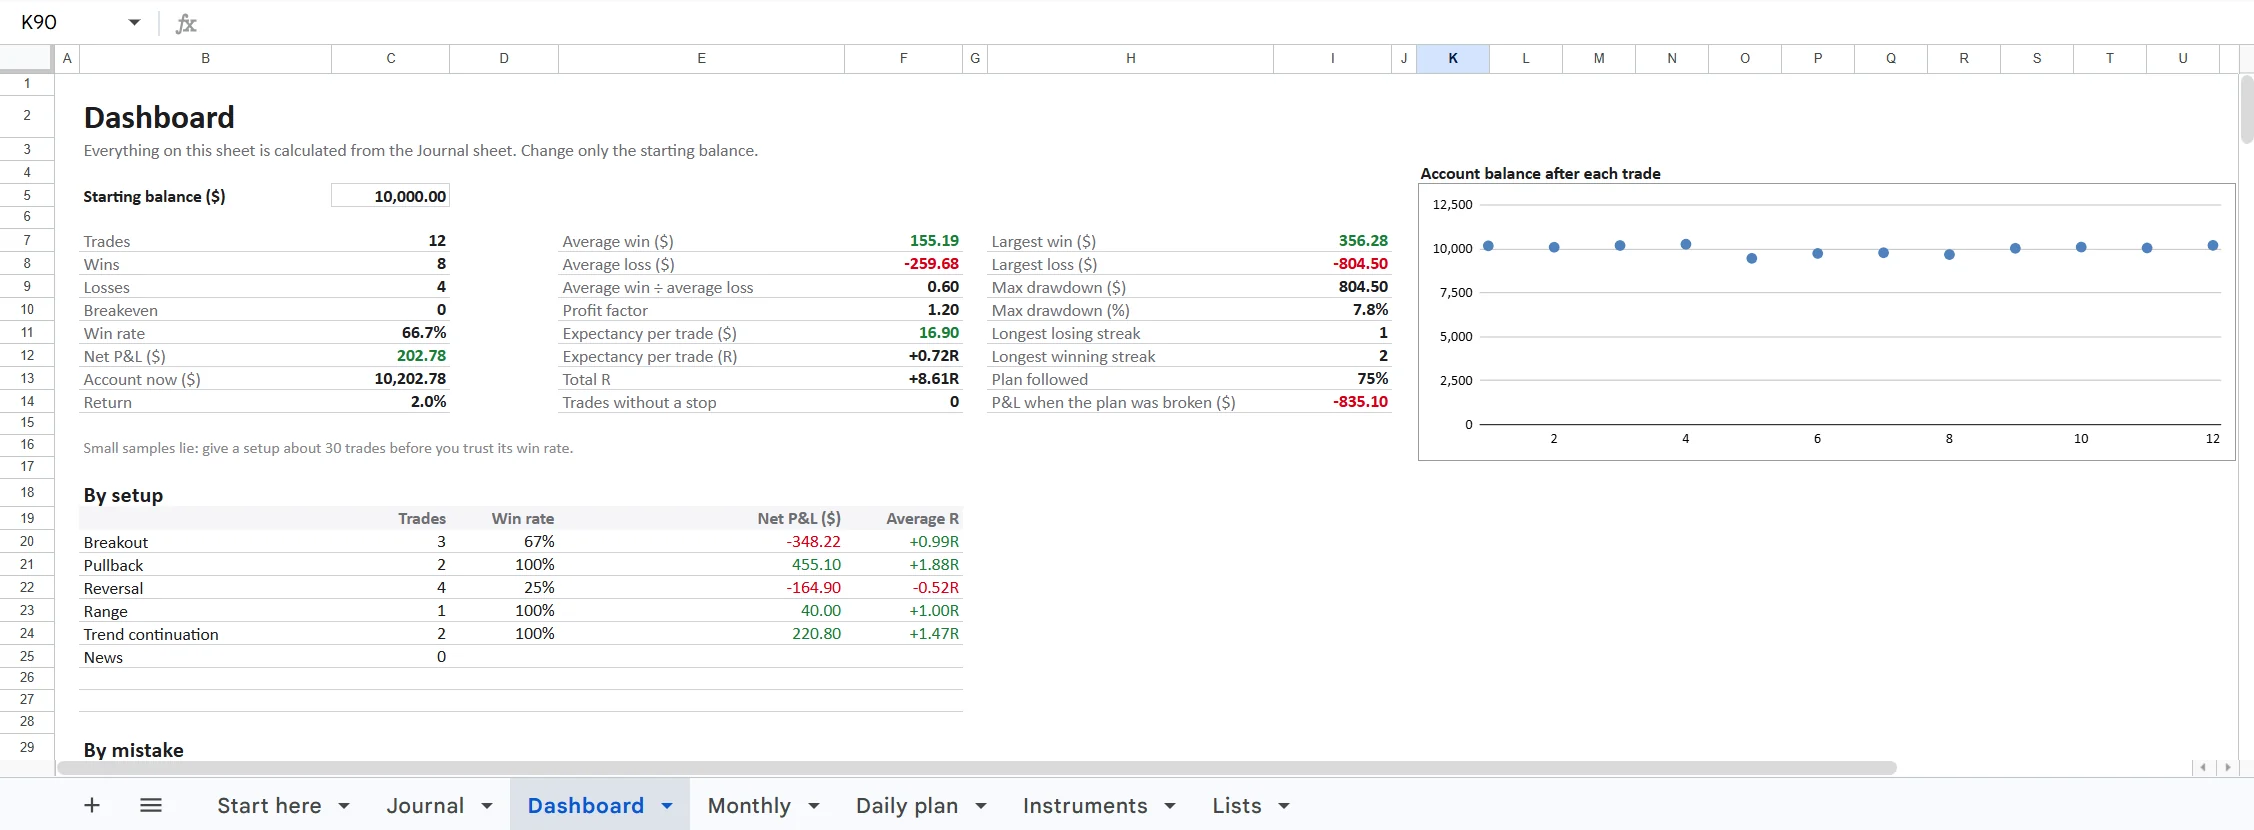
The formulas, dropdowns and numbers come across unchanged. Nothing in the file needs macros or add-ins, so it also opens in the Excel and Google Sheets apps on a phone, where adding a trade is easy and the dropdowns are a little fiddly.
When a spreadsheet stops being enough
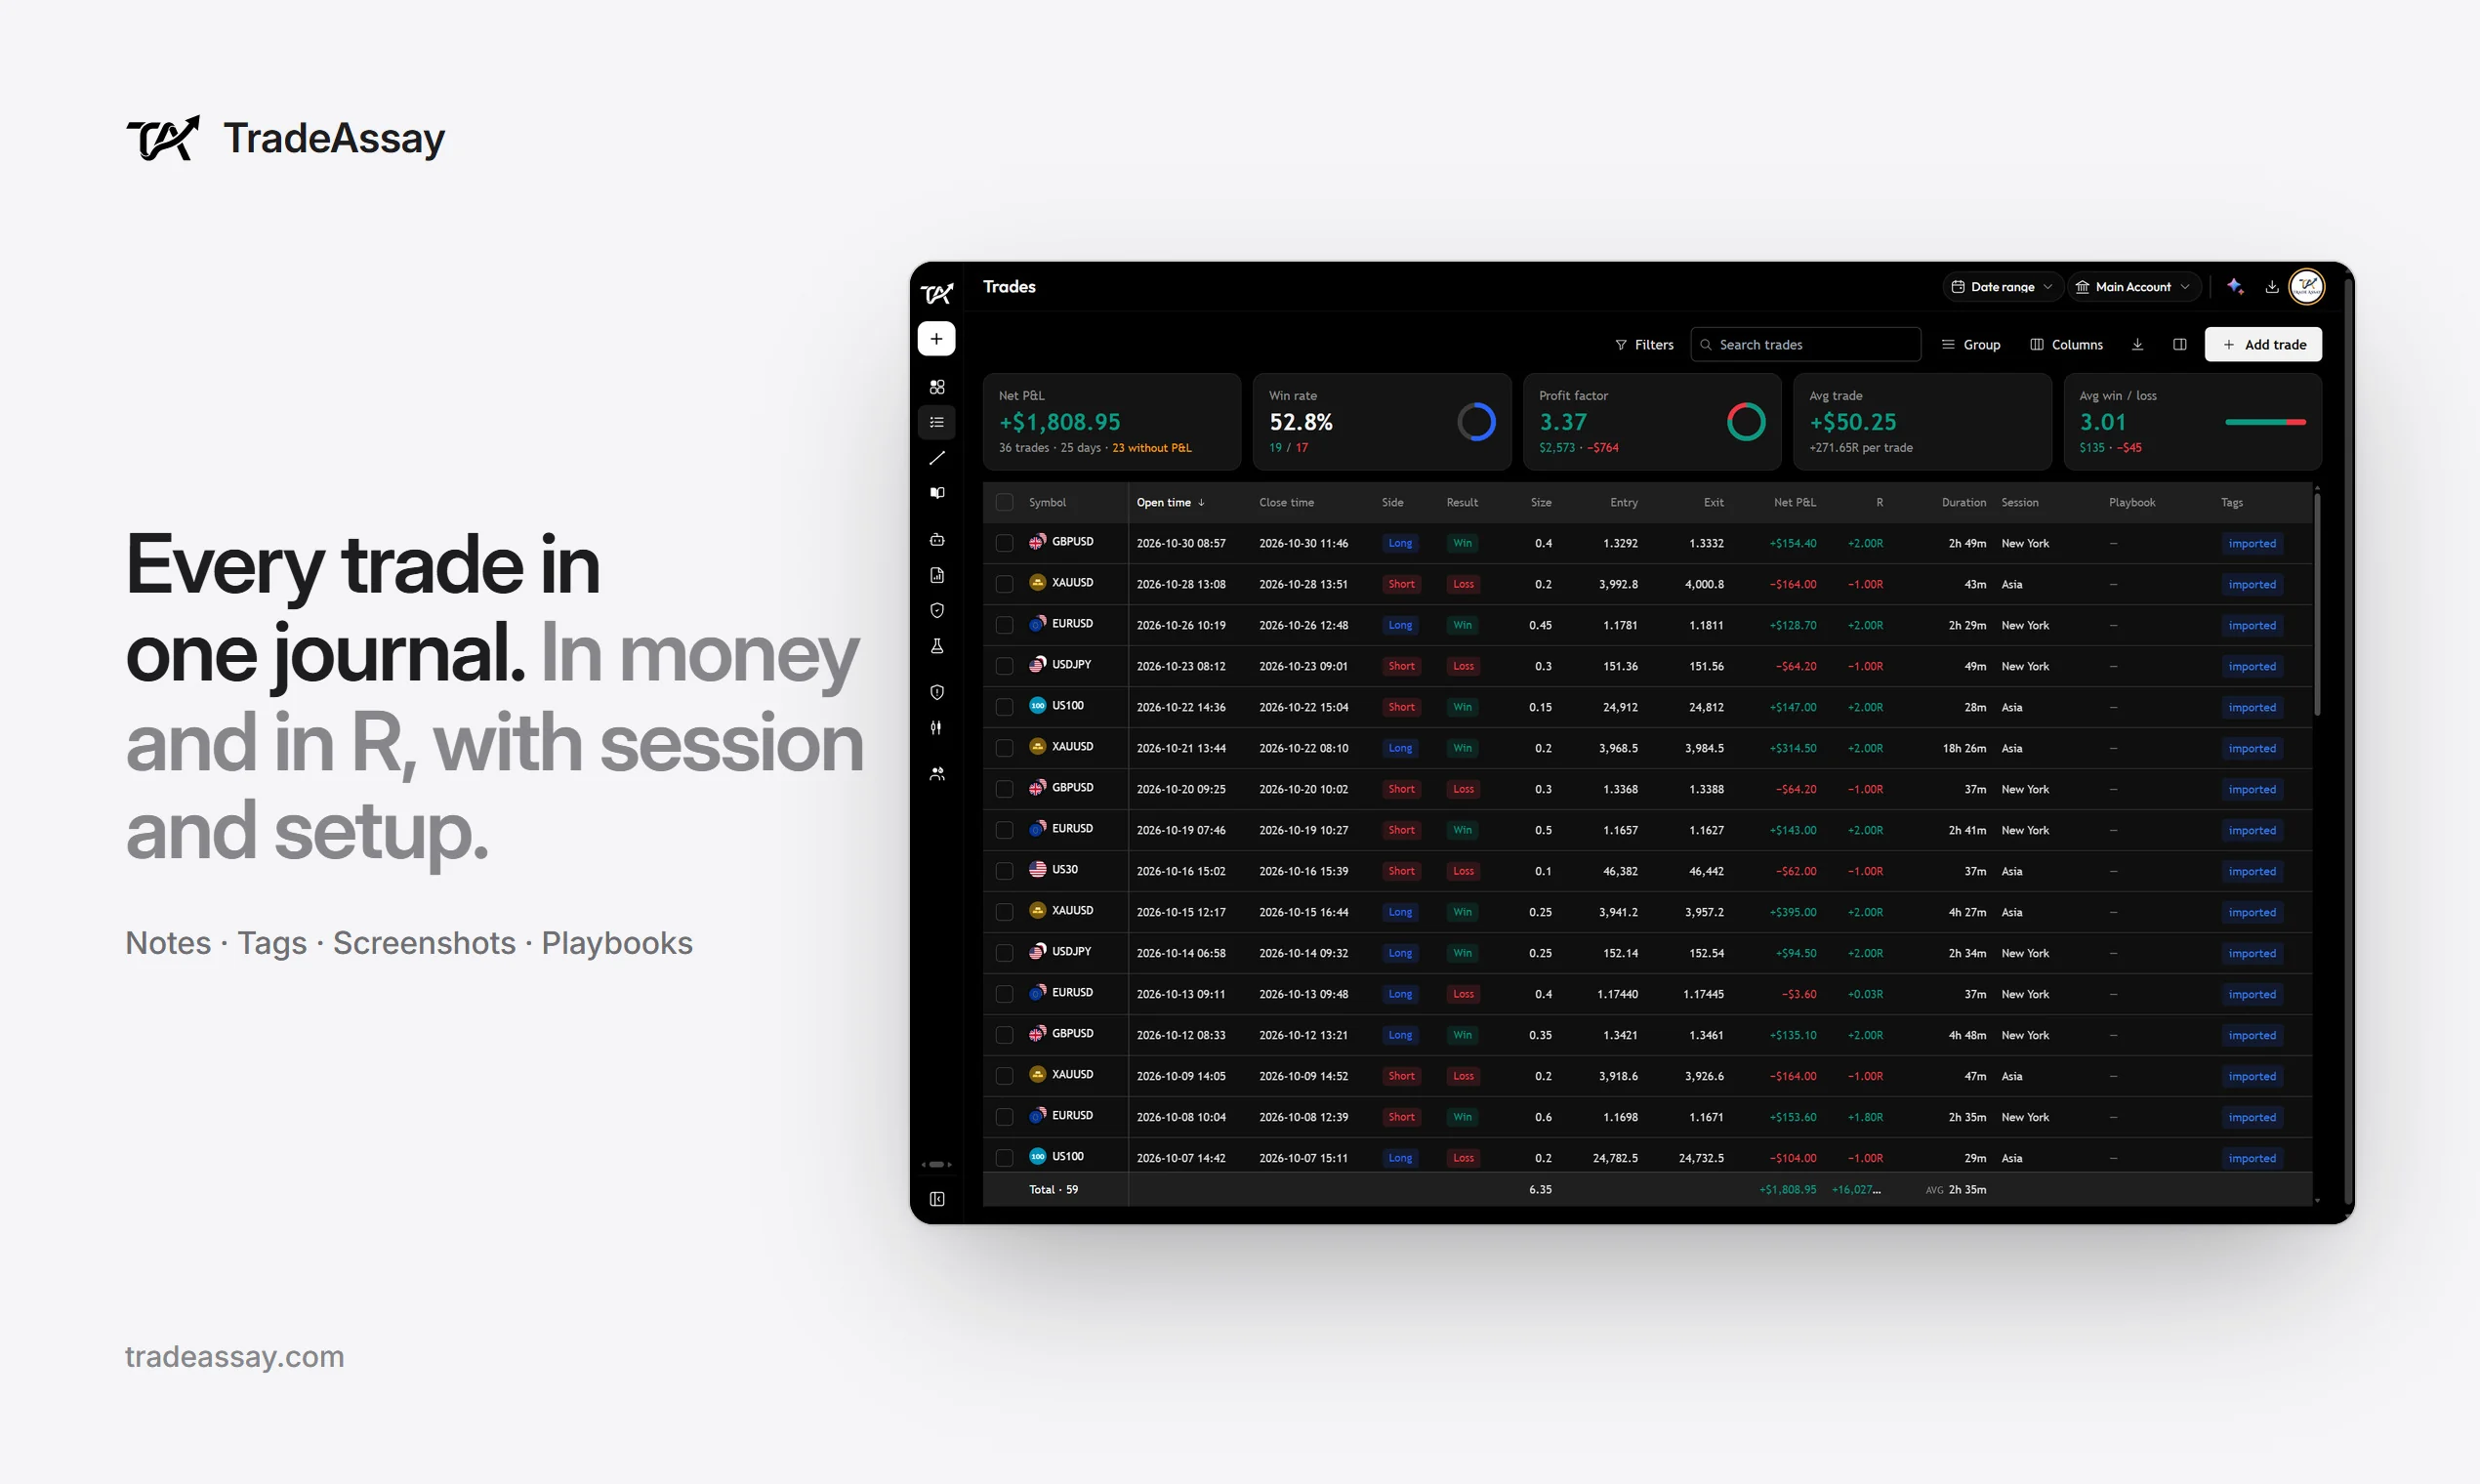
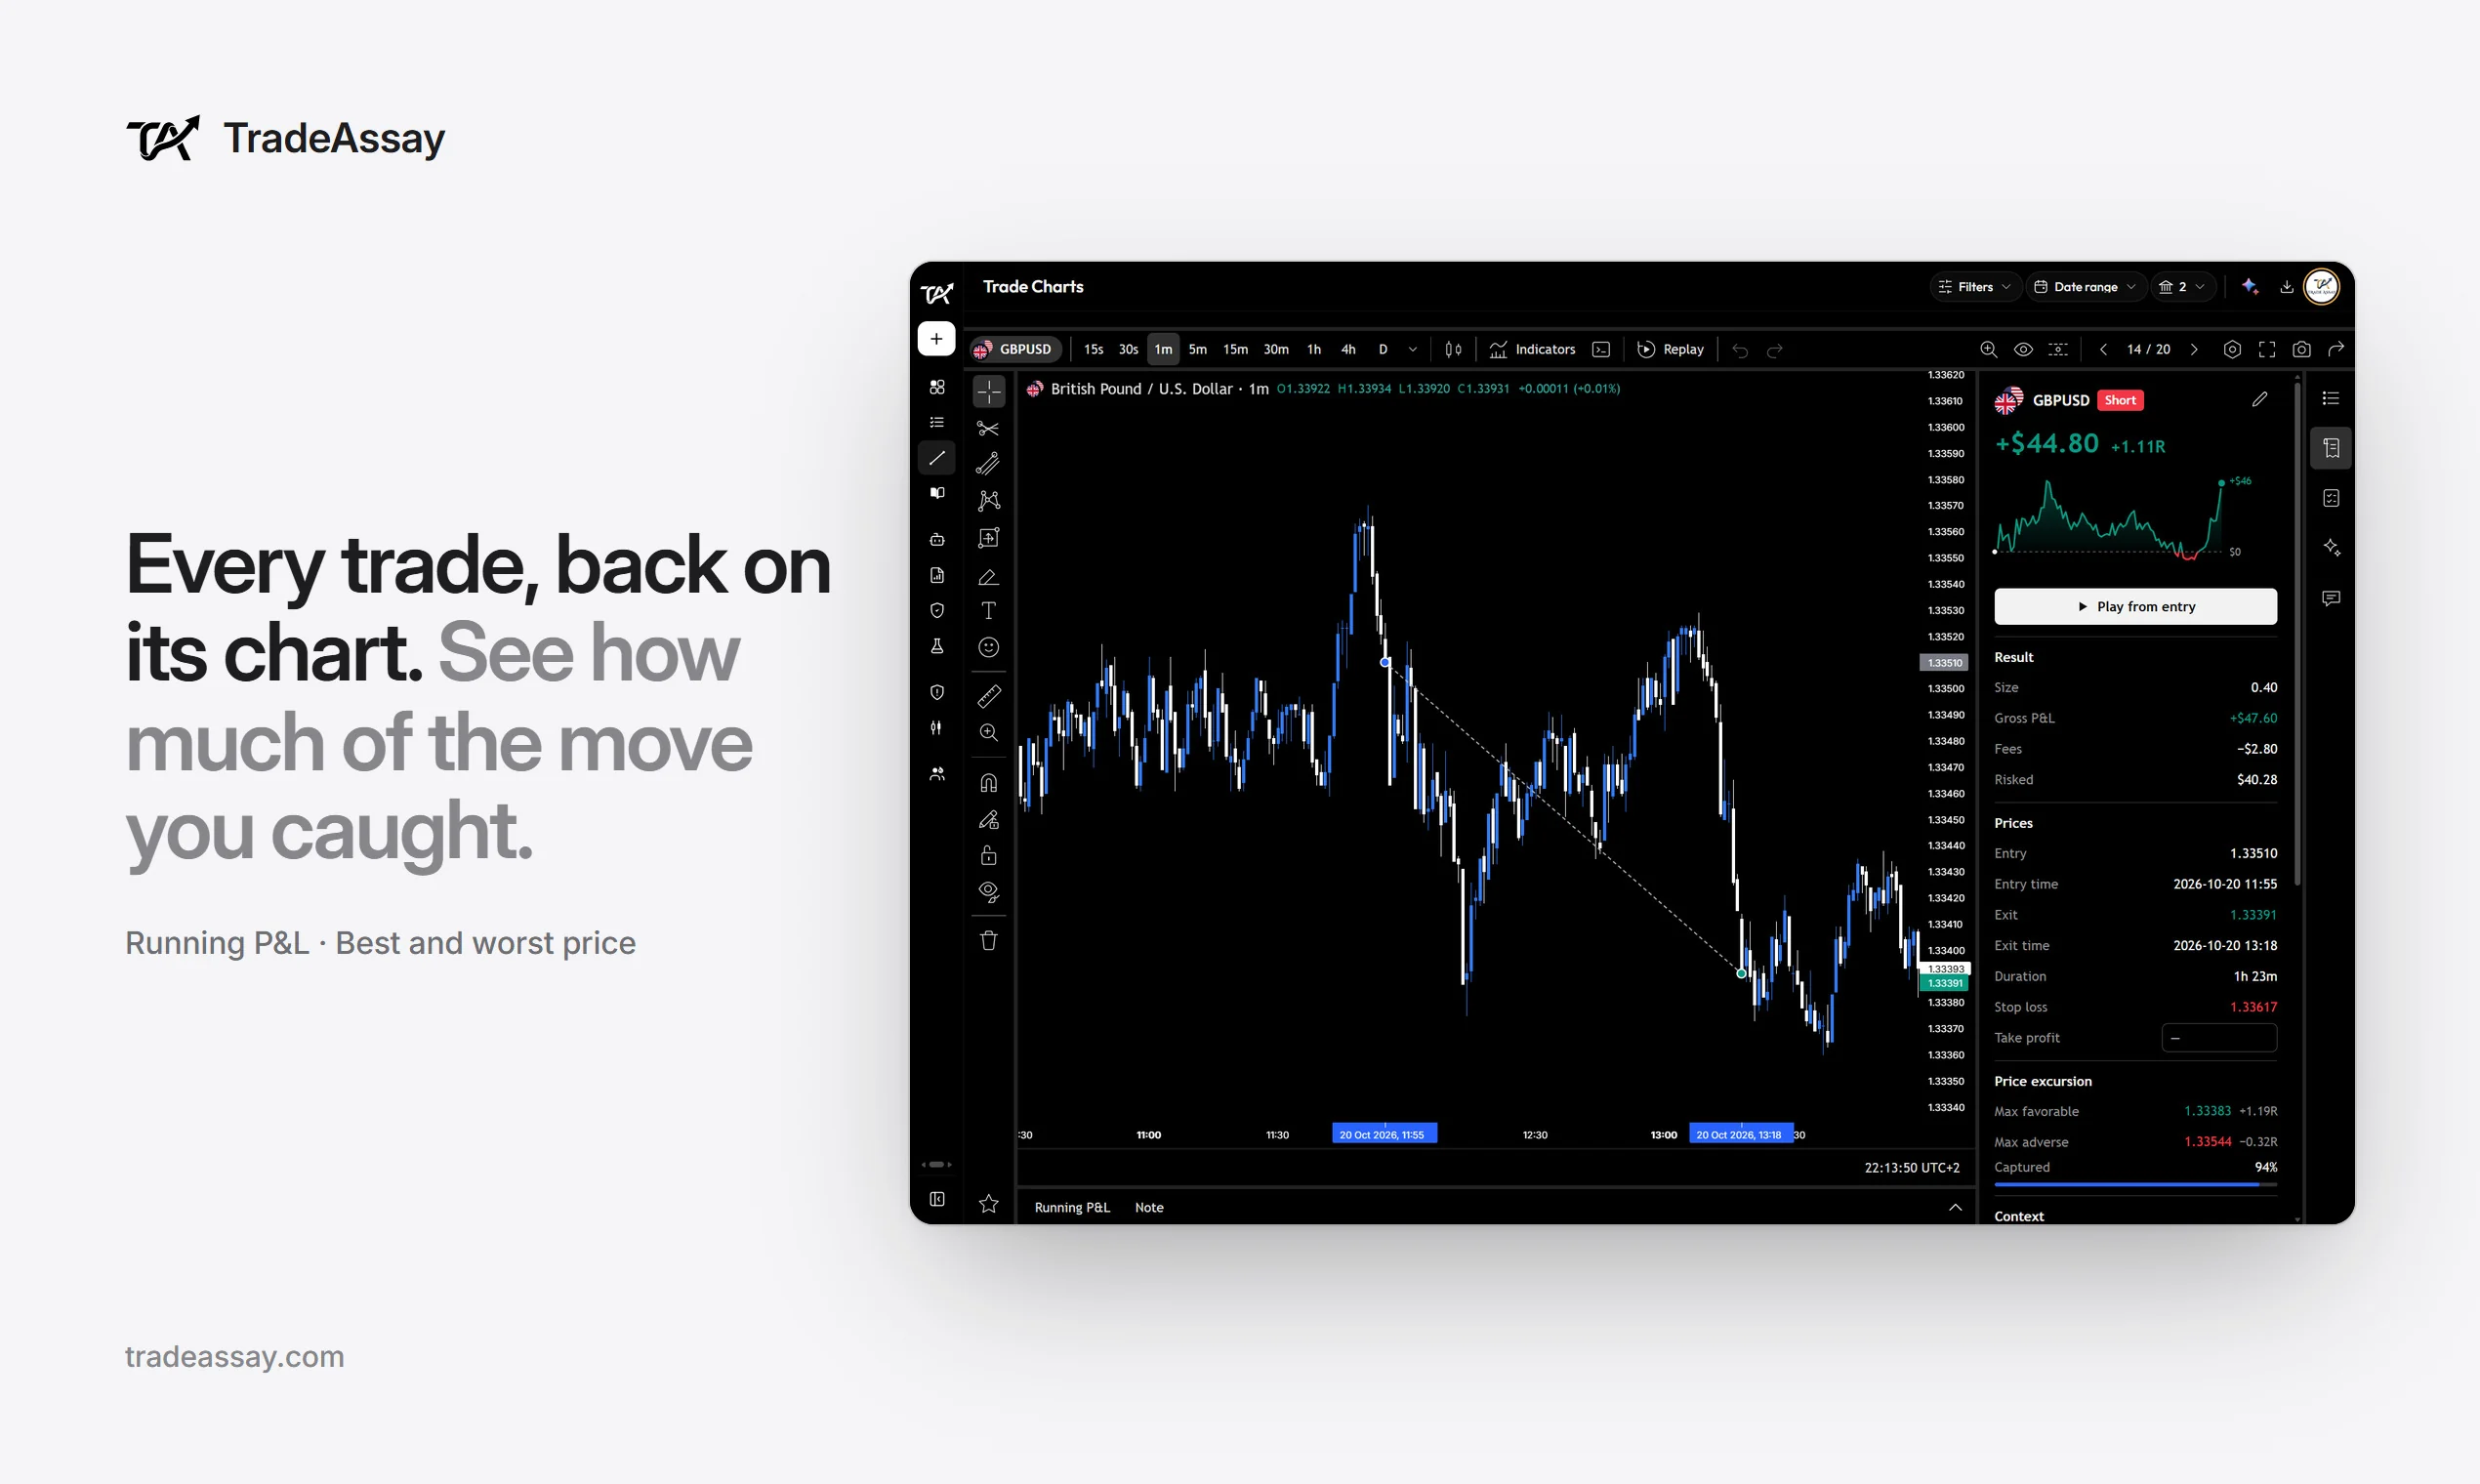
If you take a handful of trades a week, this file is all the journal you need. It starts to cost you when the typing does: thirty trades a week is roughly an hour of copying prices, a mistyped digit changes a result without telling you, and a row of numbers never shows you the chart you traded.
| This Excel template | TradeAssay | |
|---|---|---|
| Getting trades in | You type each one | Import a file (this one too) or add by hand, free. Automatic sync from MetaTrader 4 and 5, cTrader, Bybit, Binance, Hyperliquid and IBKR on Pro |
| P&L and costs | From the prices you type | Your broker's own figures, commission and swap included, when synced |
| Win rate, R, expectancy, drawdown | Yes | Yes, with a calendar, day pages and seven Analysis views, free |
| Each trade on its chart, replay | No | Pro |
| Playbooks and rule tracking | A Followed-my-plan column | Each rule ticked and priced, free |
| Backtesting | No | Unlimited on Pro and in the 7-day trial |
Moving this file into TradeAssay
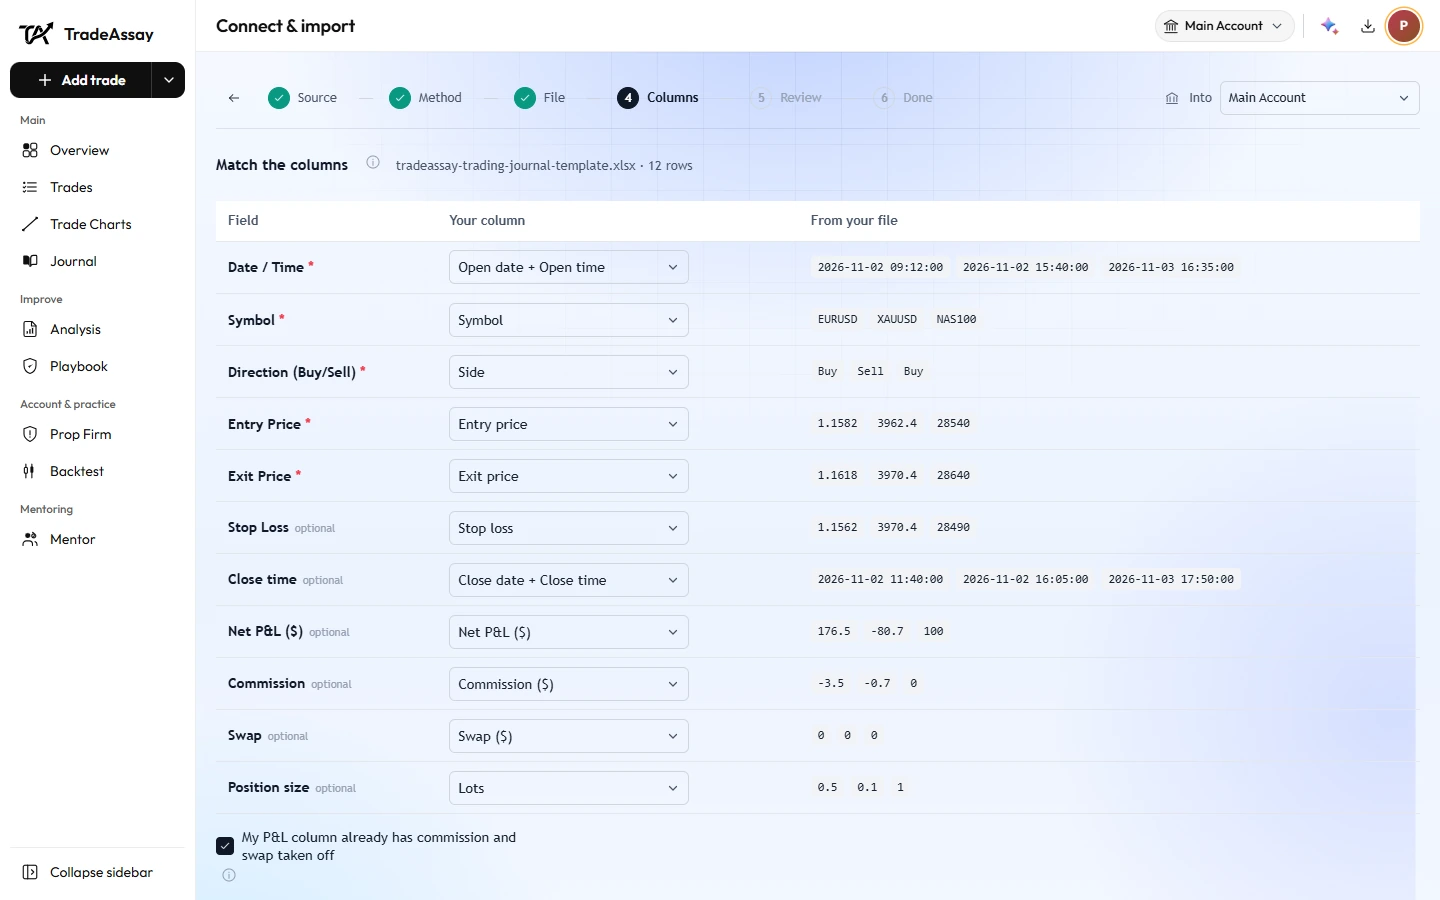
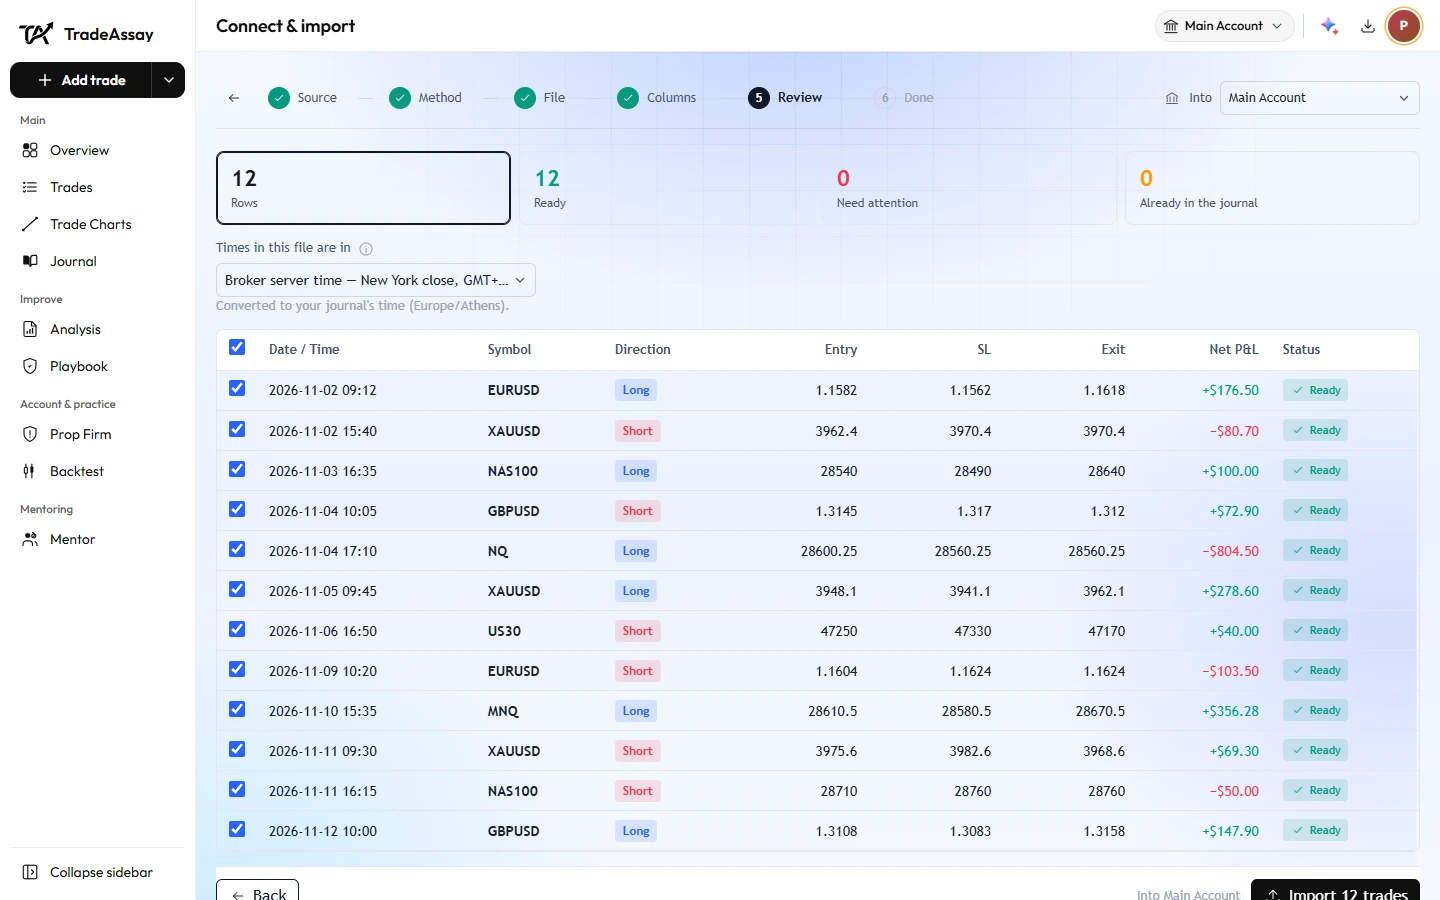
You don't lose your history when you move. In TradeAssay, open Import, choose File and pick this workbook. The columns are recognised by their names, in English, Persian or Turkish, and you see every trade before anything is saved. Setups, mistakes and notes stay in the file; the trades themselves come in.
Frequently asked questions
Is the trading journal template really free?
Yes. There is no sign-up and no email to give. Use it, change it and share it freely.
Does it work in Google Sheets and on a Mac?
Yes. It opens in Excel for Windows and Mac and in Google Sheets: upload the .xlsx to Google Drive and open it with Google Sheets. It uses no macros and no add-ins.
Is there a printable trading journal PDF?
Yes. The PDF has two A4 landscape pages: a trade log with the same columns as the spreadsheet, and a weekly review with your numbers and five questions. Print as many as you need.
What should a trading journal include?
For every trade: date and time, symbol, buy or sell, size, entry, the stop you entered with, target, exit, costs, the setup, any mistake, how you felt and whether you followed your plan. The stop and the plan column are the two that matter most.
How do I calculate R in Excel?
Divide the trade's net P&L by the money you risked to your first stop. Risk is the distance from entry to stop, times the size, times what a 1.0 move is worth: in the template, =ABS(F2-G2)*O2*E2, and R is =P2/Q2.
Why doesn't my P&L match my broker's?
Usually the contract size, which differs between brokers on index and oil CFDs, or a currency conversion. Change the number in the Instruments sheet, or type your broker's figure in Gross P&L and the sheet uses it instead.
My symbol is not in the list. What do I do?
Add a row to the Instruments sheet with what a 1.0 move is worth on one lot. Broker suffixes such as XAUUSDm, EURUSD.pro or US30.cash are recognised already.
Can I use it for a prop firm challenge?
Yes, for keeping the record: it shows your maximum drawdown, and the Daily plan sheet holds your maximum loss for the day. It does not know your firm's daily loss rule or trailing drawdown.
What is a good win rate?
There is no good win rate on its own. A 40% win rate with winners of 2R makes money; a 70% win rate with winners of 0.3R loses it. Judge a method by its expectancy in R over enough trades.

Written by the TradeAssay Team, traders with more than seven years of experience in forex, gold, indices and futures. Every number on this page was calculated by the template itself in Microsoft Excel.
When the typing starts to cost you reviews, TradeAssay keeps the same journal for you, with every trade on its chart.
Start freeTrading foreign exchange, futures and other leveraged products carries a high level of risk and is not suitable for every investor. This template and this page are a record-keeping tool and illustrative arithmetic, not investment advice. The example trades are examples, not results.